Fig. 11.
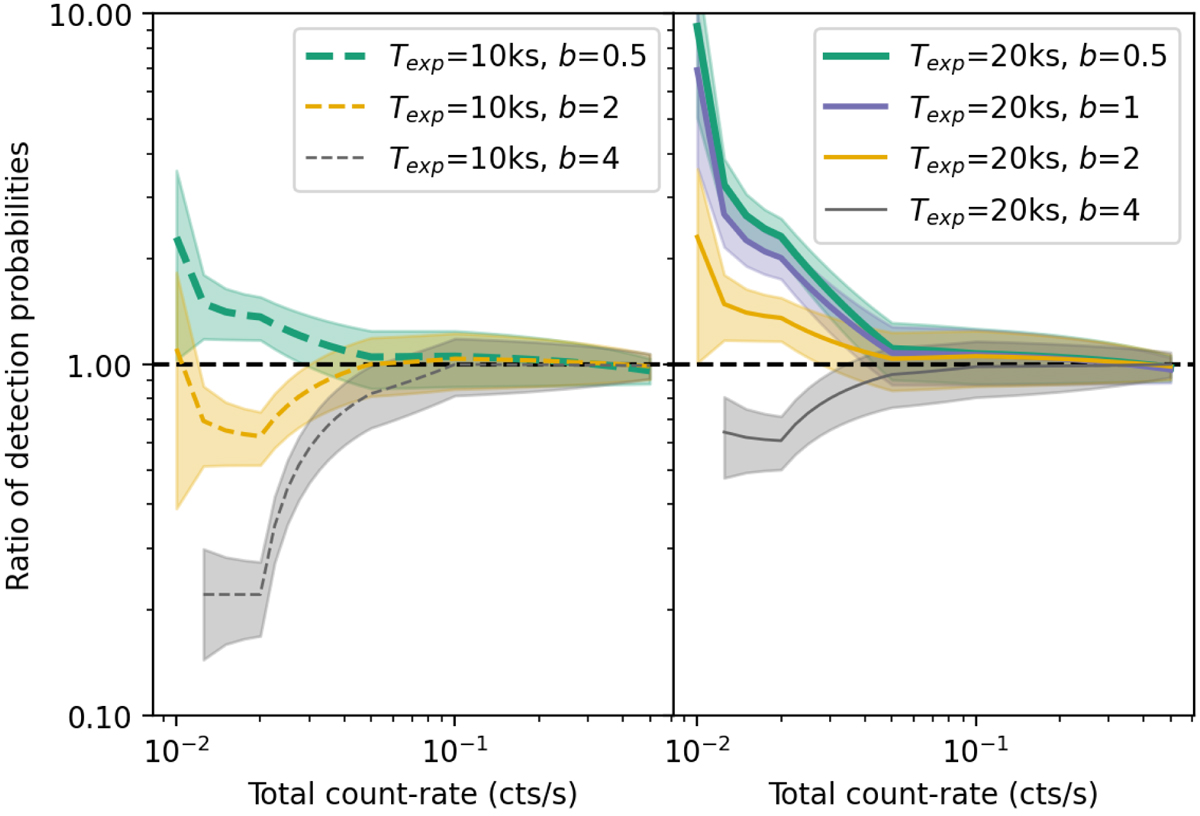
Variation of the C1 detection efficiency with exposure time and background level. Curves show the ratio relative to the probability shown in Fig. 10 (exposure time of 10 ks and b = 1), assuming an apparent core radius Rc = 20″. Shaded regions represent the standard deviation around these values, which depends on the number of simulated clusters. Only points with more than nine detected simulated clusters are shown.
Current usage metrics show cumulative count of Article Views (full-text article views including HTML views, PDF and ePub downloads, according to the available data) and Abstracts Views on Vision4Press platform.
Data correspond to usage on the plateform after 2015. The current usage metrics is available 48-96 hours after online publication and is updated daily on week days.
Initial download of the metrics may take a while.