Free Access
Fig. 8.
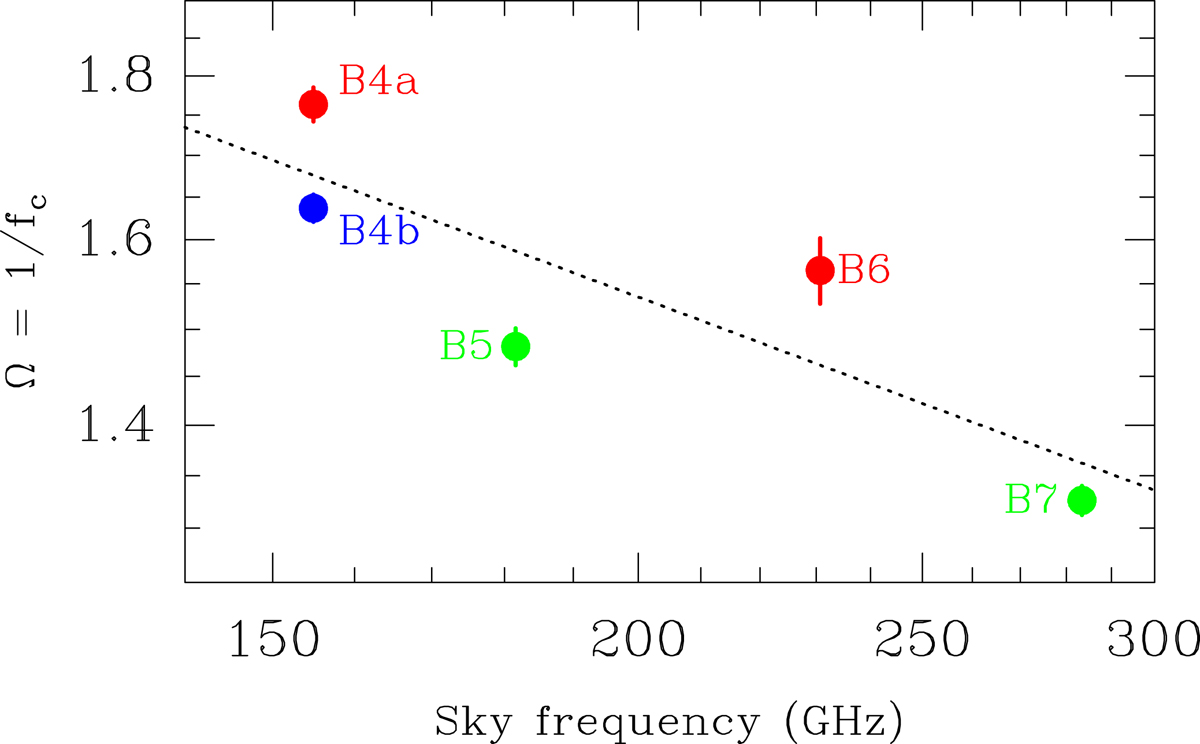
Evolution of the inverse of the covering factor with frequency (both axes are on a logarithmic scale). The color-code indicates the observing epoch (red: 2019 Jul 10-11, green: 2019 Jul 28, and blue: 2019 Aug 17).
Current usage metrics show cumulative count of Article Views (full-text article views including HTML views, PDF and ePub downloads, according to the available data) and Abstracts Views on Vision4Press platform.
Data correspond to usage on the plateform after 2015. The current usage metrics is available 48-96 hours after online publication and is updated daily on week days.
Initial download of the metrics may take a while.