Fig. 7.
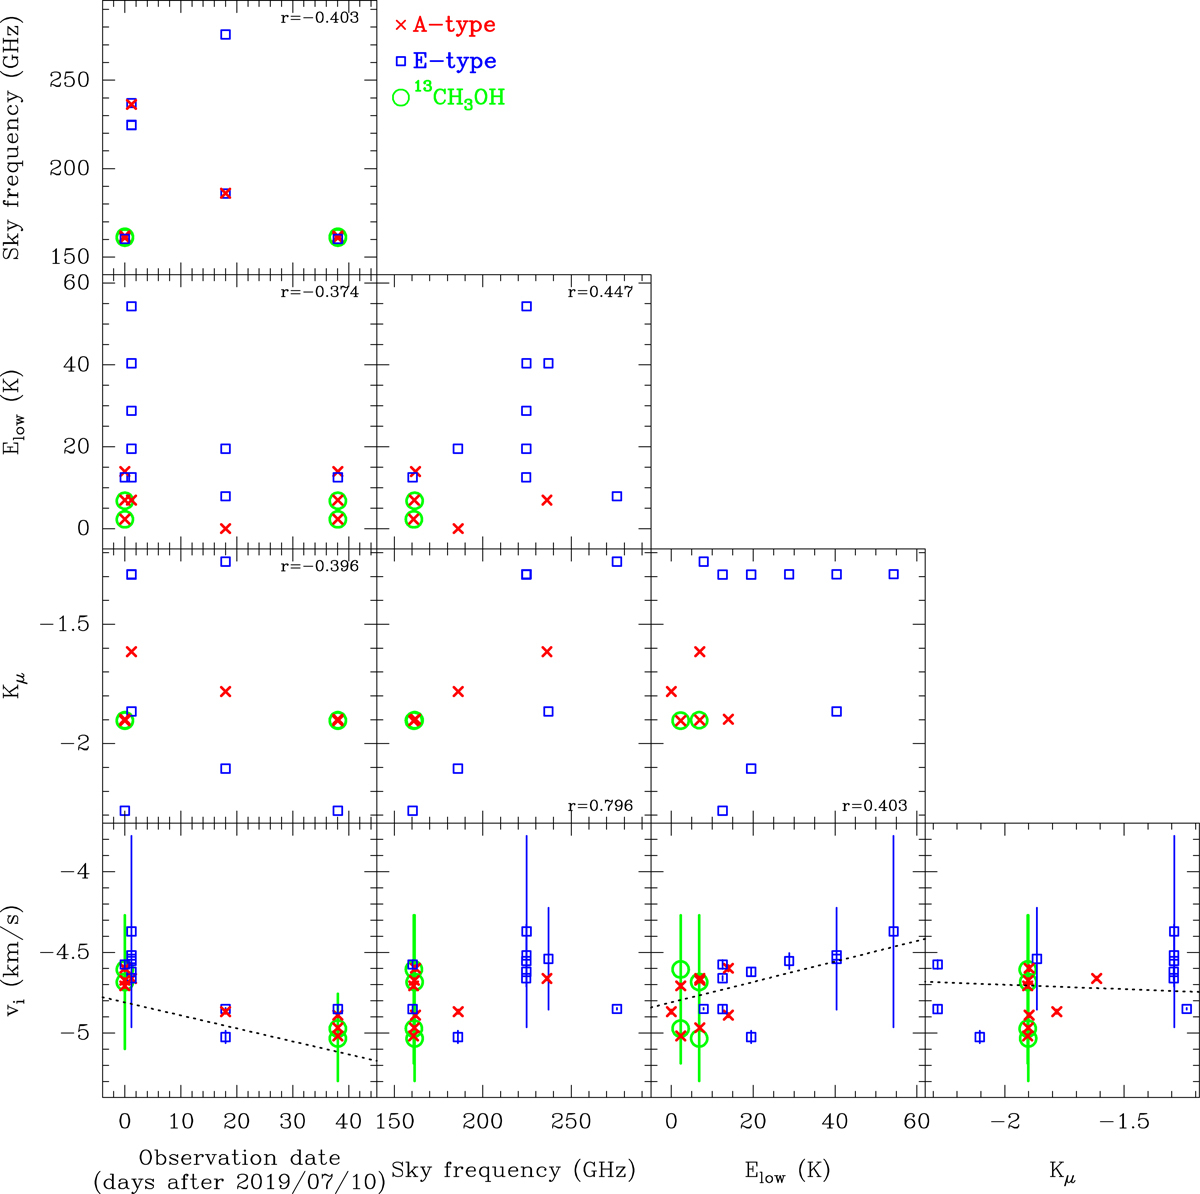
Distribution matrix of relative bulk velocity offsets (δv), low-level energies (Elow), proton-electron sensitivity coefficients (Kμ), sky frequencies, and observation epochs, for observed methanol lines (Tables 2 and A.1). The Pearson r coefficients of the correlation matrix are given between the different variables. The data points corresponding to A-CH3OH and E-CH3OH transitions are marked with red crosses and blue squares, respectively. Those of 13CH3OH are indicated with green circles. The best results of the multivariate linear regression fit between the vi, time, Elow, and Kμ (see Table 3) are shown in the corresponding panels.
Current usage metrics show cumulative count of Article Views (full-text article views including HTML views, PDF and ePub downloads, according to the available data) and Abstracts Views on Vision4Press platform.
Data correspond to usage on the plateform after 2015. The current usage metrics is available 48-96 hours after online publication and is updated daily on week days.
Initial download of the metrics may take a while.