Fig. 5.
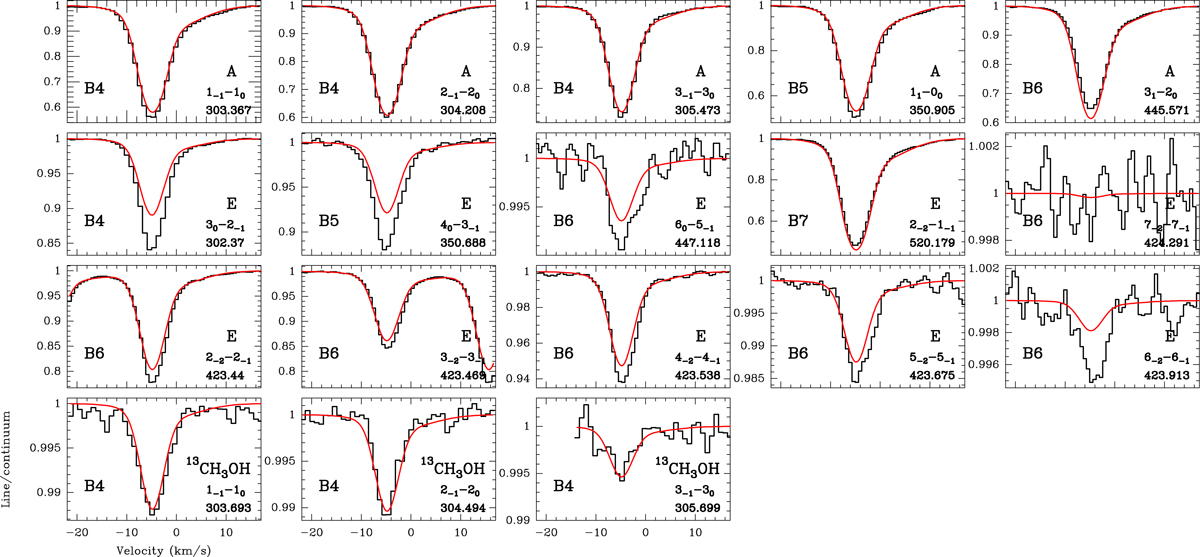
RADEX excitation best-fit model (Tkin = 9 K, nH2 = 1.3 × 105 cm−3, A/E = 1, and Ncol(A) = 1.8 × 1014 cm−2 and 0.7 × 1014 cm−2 for the G1 and G2 velocity components in Table 2, respectively), overlaid in red on top of the ALMA methanol spectra toward the southwest image of PKS 1830−211. The methanol type, quantum numbers (JK), and rest frequency (GHz) are given in the bottom right corner for each transition. The ALMA band is given in the bottom left of each frame. The last row shows the 13CH3OH spectra (all of A type), with the RADEX fit of the corresponding transitions of the main isotopologue, scaled down by a factor 62; hence, these lines were not taken into account in the χ2 minimization.
Current usage metrics show cumulative count of Article Views (full-text article views including HTML views, PDF and ePub downloads, according to the available data) and Abstracts Views on Vision4Press platform.
Data correspond to usage on the plateform after 2015. The current usage metrics is available 48-96 hours after online publication and is updated daily on week days.
Initial download of the metrics may take a while.