Fig. 4.
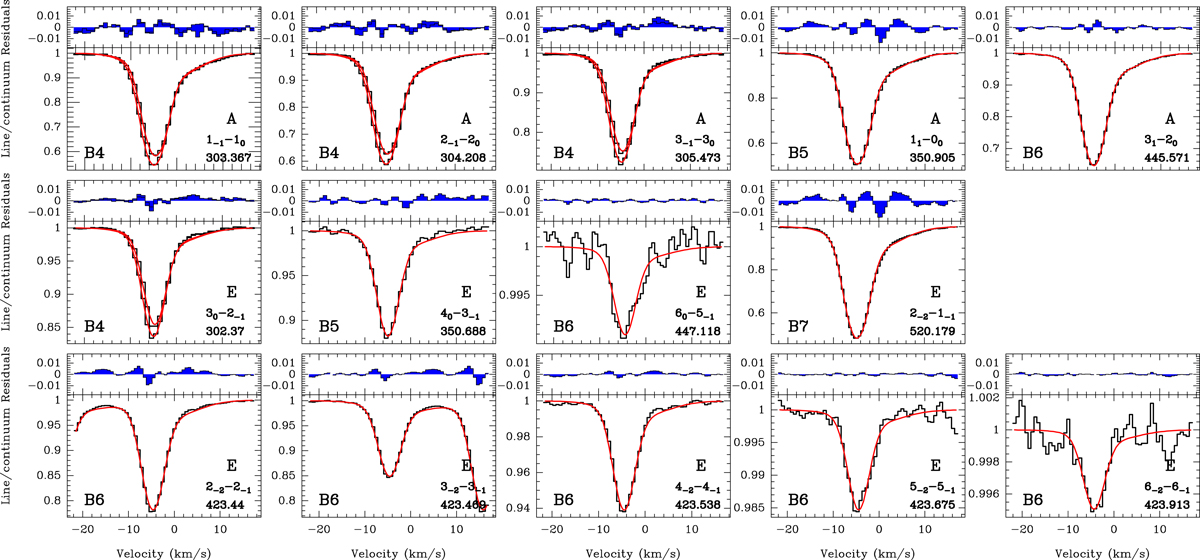
Spectra of methanol transitions observed with ALMA toward the southwest image of PKS 1830−211, with best fits of the common two-Gaussian velocity component profile. The best fit is overlaid in red, and the fit residuals (data-model) are shown on top of each frame. The methanol form, quantum numbers (JK), and rest frequency (GHz) are given in the bottom right corner for each line. For B4 lines, the two visits are shown separately, with their respective fits. The ALMA band is given in the lower left corners.
Current usage metrics show cumulative count of Article Views (full-text article views including HTML views, PDF and ePub downloads, according to the available data) and Abstracts Views on Vision4Press platform.
Data correspond to usage on the plateform after 2015. The current usage metrics is available 48-96 hours after online publication and is updated daily on week days.
Initial download of the metrics may take a while.