Fig. 3.
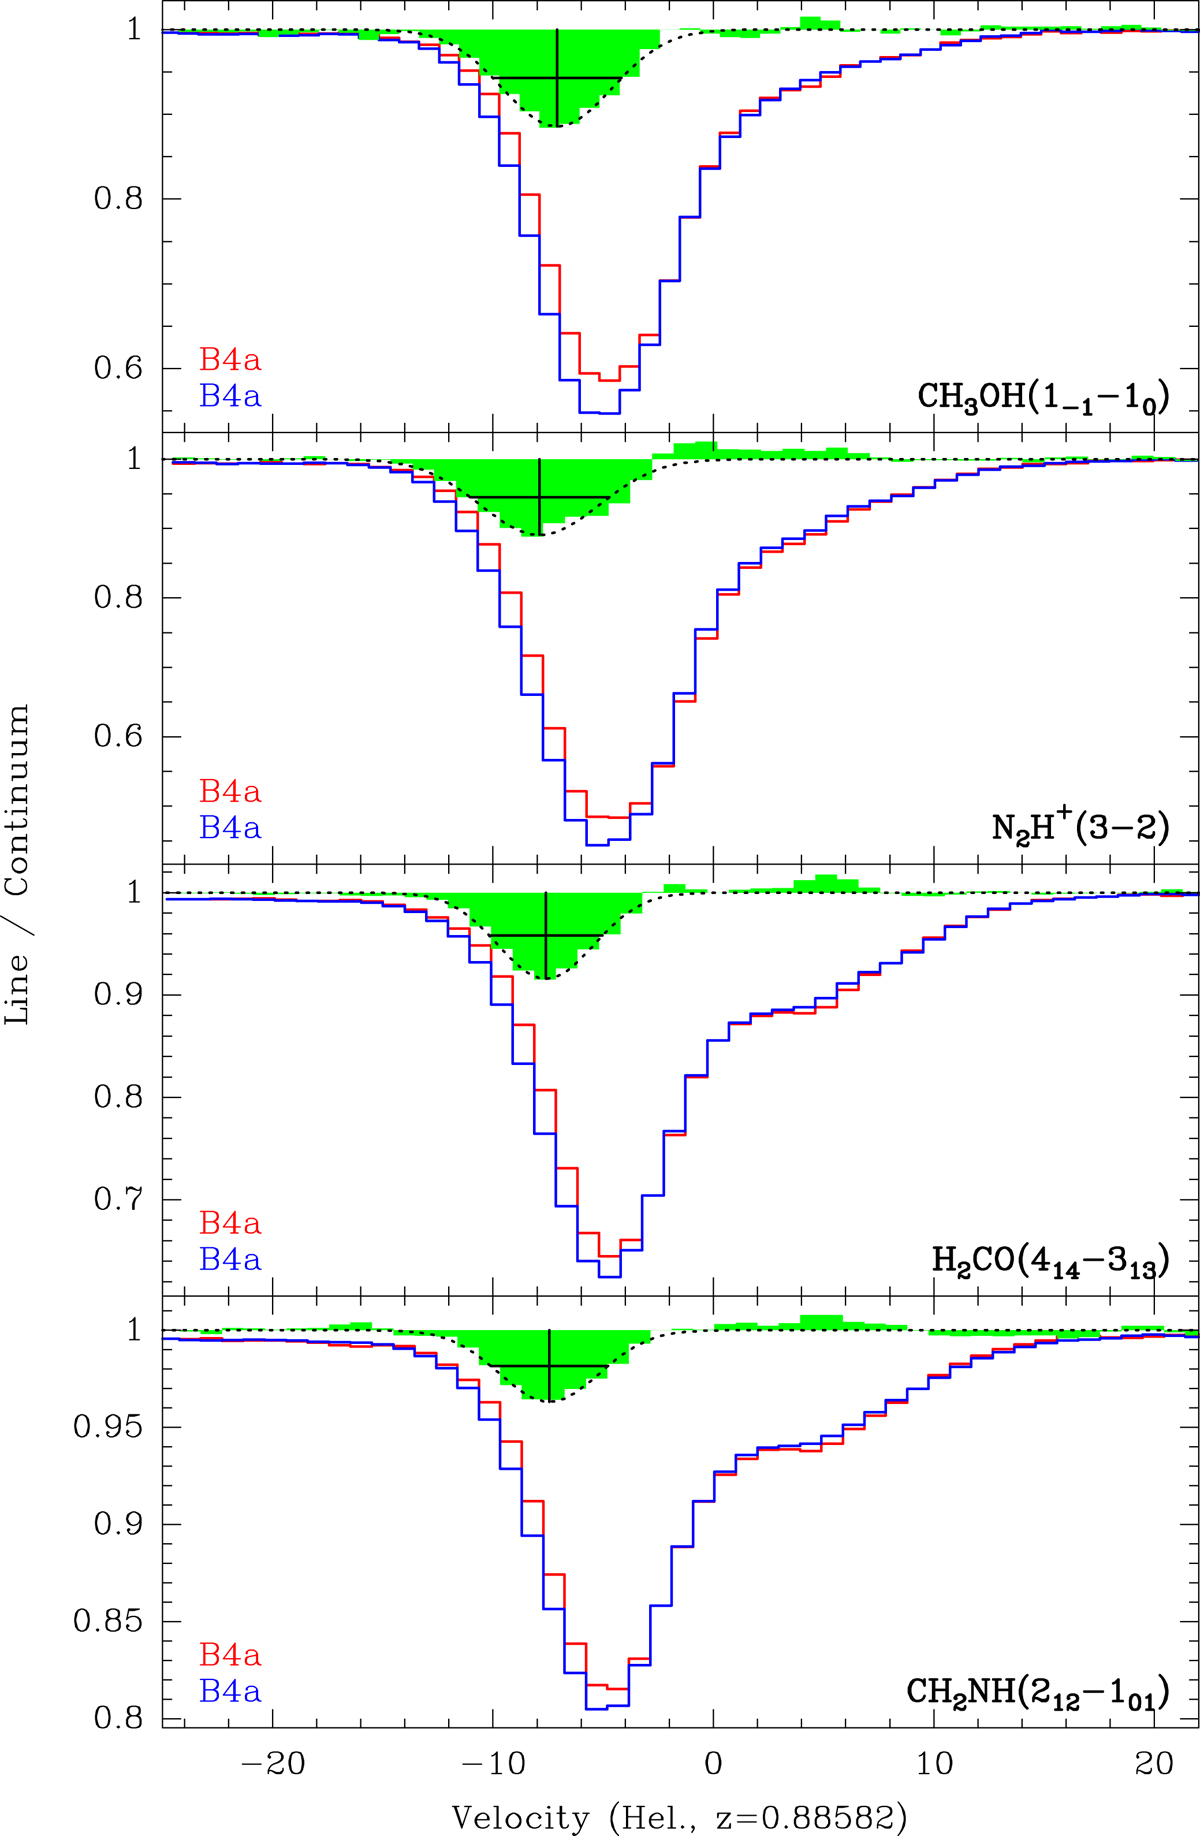
Spectra of lines from CH3OH, N2H+, H2CO, and CH2NH, observed simultaneously on 2019 July 10 (B4a, in red) and August 17 (B4b, in blue). The difference spectra (B4b–B4a) are shown in green, multiplied by a factor two and shifted to unity. The best Gaussian fit to each of the difference spectra is overlaid as a dotted line, the cross indicating the velocity centroid, amplitude, and full-width at half maximum of the Gaussian.
Current usage metrics show cumulative count of Article Views (full-text article views including HTML views, PDF and ePub downloads, according to the available data) and Abstracts Views on Vision4Press platform.
Data correspond to usage on the plateform after 2015. The current usage metrics is available 48-96 hours after online publication and is updated daily on week days.
Initial download of the metrics may take a while.