Fig. 2.
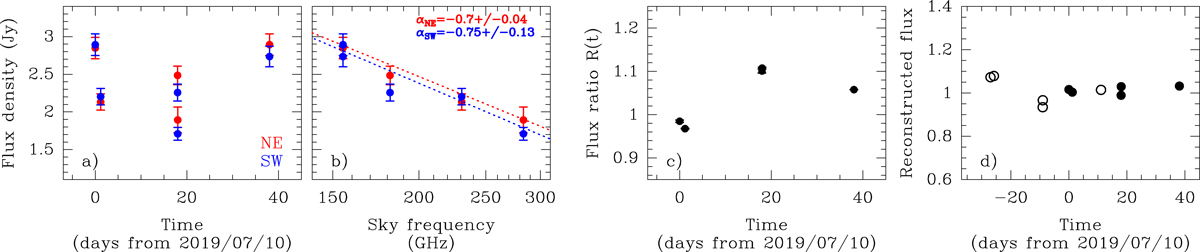
Temporal variations of the continuum emission of PKS 1830−211. (a) Evolution of the flux density of the northeast (red) and southwest (blue) lensed images during our ALMA campaign. (b) Spectral energy distribution (the frequency axis is on a logarithmic scale) of the two images (i.e., same data points as for (a) but now displayed as function of frequency), with the best fit of a F = F0(ν/ν0)α relationship indicated in dotted lines for each image. (c) Evolution of the instantaneous flux ratio R(t) = FNE/FSW. (d) Reconstructed flux density history (normalized by a flux F = 2.87 Jy at a frequency of 150 GHz and adopting a spectral index α = −0.7). The filled black dots correspond to datapoints from the northeast image, while the empty circles correspond to that from the southwest image, delayed in time by 27 days and rescaled adopting a relative magnification factor of 1.04 between the two images.
Current usage metrics show cumulative count of Article Views (full-text article views including HTML views, PDF and ePub downloads, according to the available data) and Abstracts Views on Vision4Press platform.
Data correspond to usage on the plateform after 2015. The current usage metrics is available 48-96 hours after online publication and is updated daily on week days.
Initial download of the metrics may take a while.