Fig. 1.
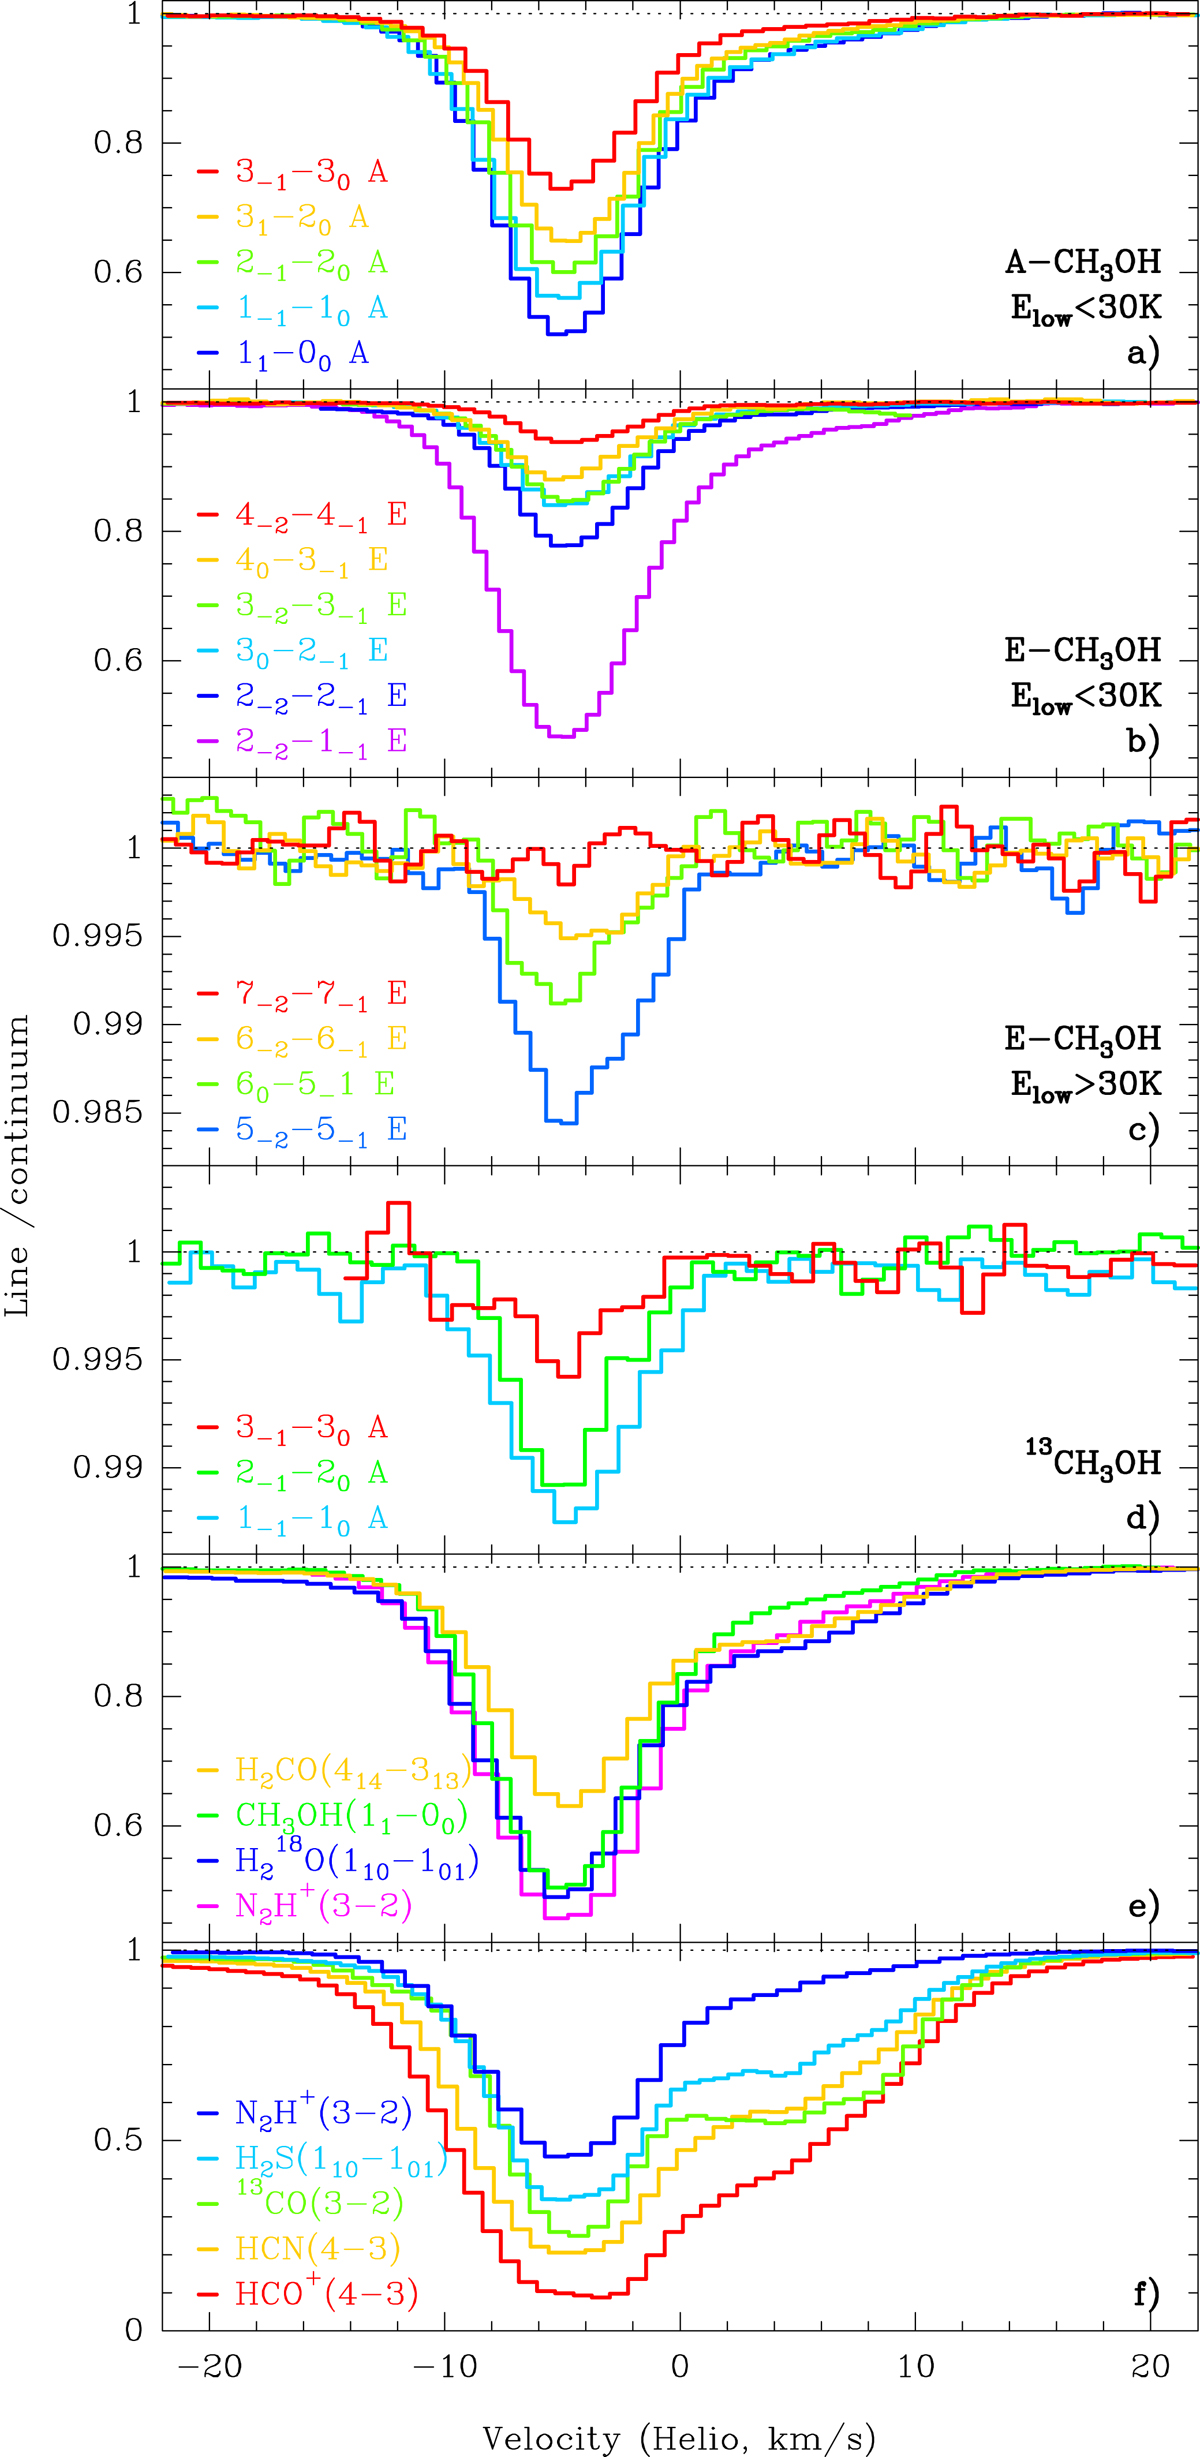
ALMA spectra of methanol and several other species observed toward the southwest image of PKS 1830−211 during our campaign (July-August 2019). For lines in B4, the spectra were averaged over both B4a and B4b observations (see Fig. 3 for time variability). To avoid crowded plots and large spreads in absorption depths, the lines from A-CH3OH (a), E-CH3OH (b,c), and 13CH3OH (d) are separated, and they are also split according to low-level energy Elow < 30 K (b) and Elow > 30 K (c) for E-CH3OH. For comparison, some other species are shown in (e), for intermediate opacity lines, and (f), for lines with the highest opacity.
Current usage metrics show cumulative count of Article Views (full-text article views including HTML views, PDF and ePub downloads, according to the available data) and Abstracts Views on Vision4Press platform.
Data correspond to usage on the plateform after 2015. The current usage metrics is available 48-96 hours after online publication and is updated daily on week days.
Initial download of the metrics may take a while.