Fig. 3
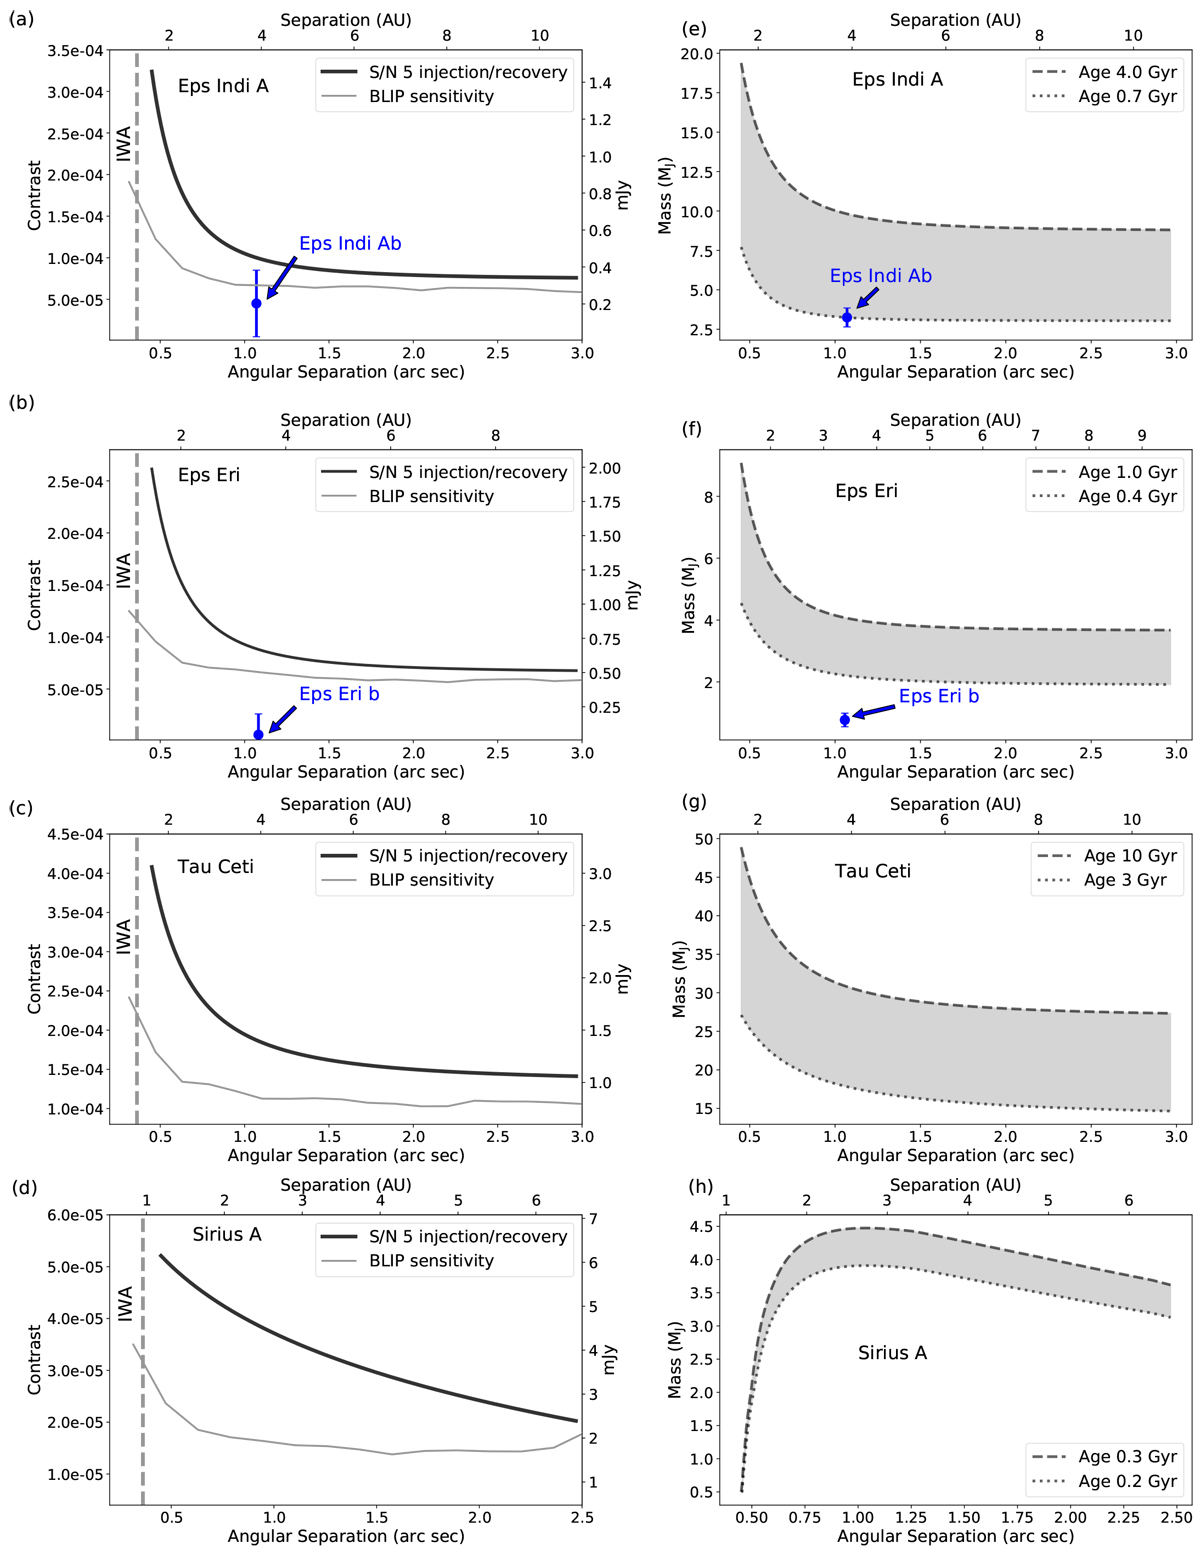
Panels a-d show 5 σ contrast curves and background-noise-limited imaging performance. Panels e-h show the mass limits derived using contrast curves. The solid line is derived using artificial injection and recovery tests, and the thin line represents the 5 σ BLIP sensitivity. The detection limits would improve with ![]() and observing conditions. The different shape of the curves in (h) is due to the strong irradiation of the planet by the star, as discussed in Sect. 5.4.
and observing conditions. The different shape of the curves in (h) is due to the strong irradiation of the planet by the star, as discussed in Sect. 5.4.
Current usage metrics show cumulative count of Article Views (full-text article views including HTML views, PDF and ePub downloads, according to the available data) and Abstracts Views on Vision4Press platform.
Data correspond to usage on the plateform after 2015. The current usage metrics is available 48-96 hours after online publication and is updated daily on week days.
Initial download of the metrics may take a while.