Fig. 2
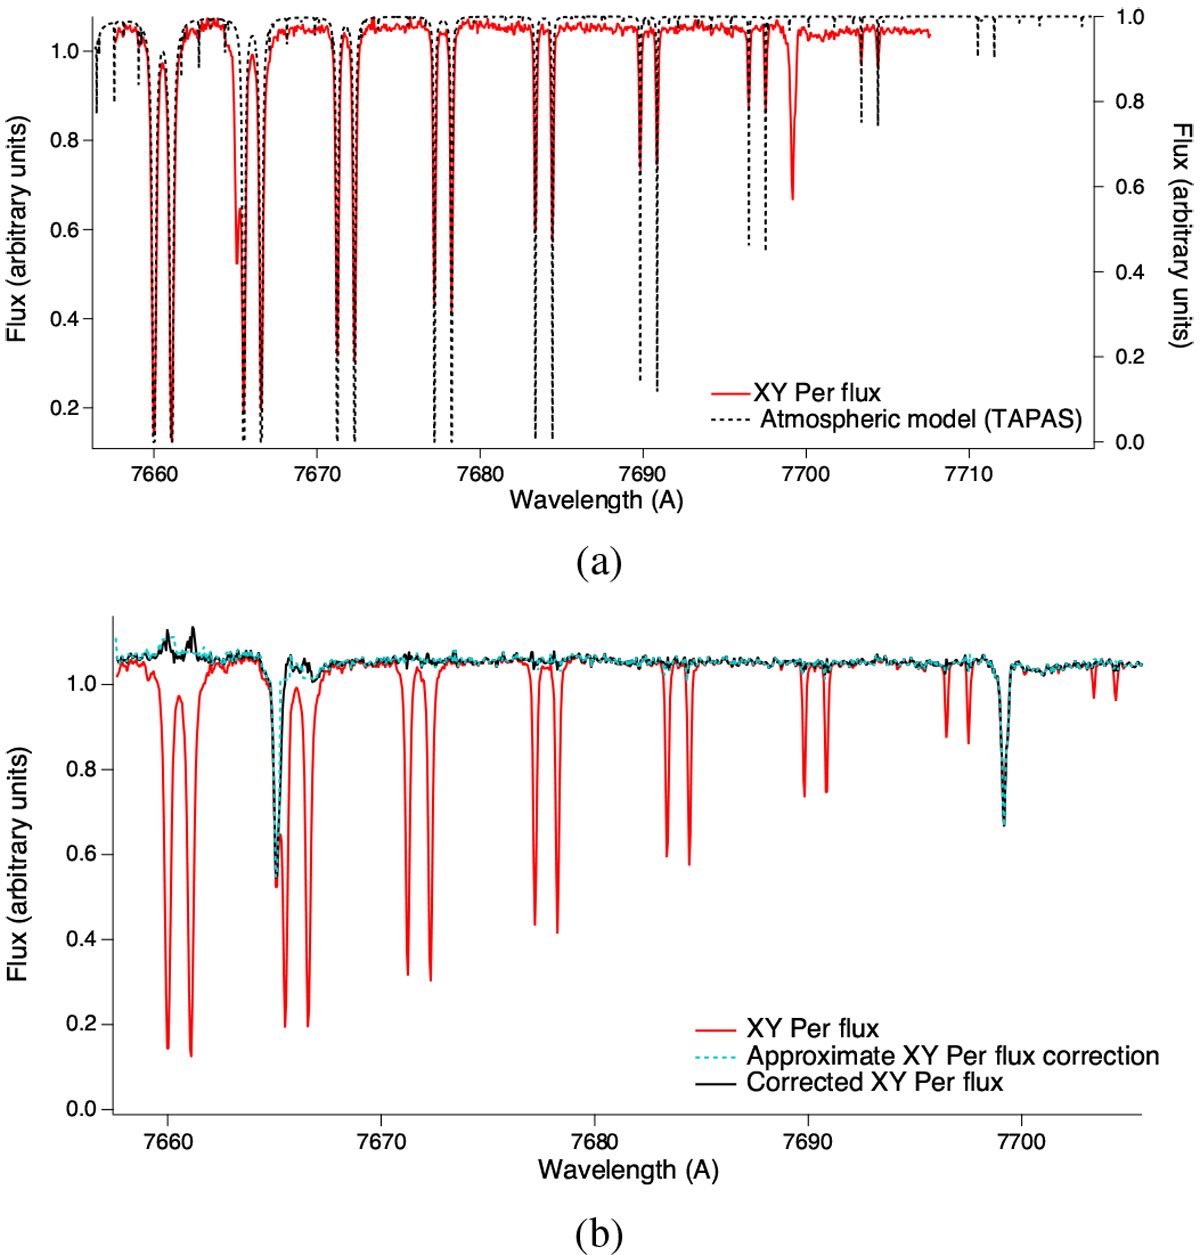
Illustration of the telluric correction, prior to the dual interstellar-telluric profile-fitting. The TAPAS model was selected forthe Pic du Midi observatory. (a) Atmospheric profile (black color, right axis) after adjustment to the observation, superimposed on the initial stellar spectrum (here the star XY Per, red color, left axis). We note that this is the atmospheric profile before convolution by the instrumental profile, which is used at the next step of profile-fitting. (b) Corrected stellar spectrum (black line) obtained by division of the raw data by the above atmospheric profile, after its convolution by the instrumental profile. It is superimposed on the initial stellar spectrum (red line). There are some spiky residuals in the strong absorption areas which are due to the division of weak quantities for both the data and models. Also shown is thequasi-continuum obtained from the corrected spectrum after some interpolation at these regions (turquoise dashed line). Here, the residuals are weak and there is only a very small difference between the two curves. We note that in this figure we want to illustrate the accuracy of the atmospheric model and the achieved level of adjustment: none of these corrected spectra will enter the dual telluric-interstellar profile-fitting, instead only the adjusted preinstrumental profile shown at the top will be used.
Current usage metrics show cumulative count of Article Views (full-text article views including HTML views, PDF and ePub downloads, according to the available data) and Abstracts Views on Vision4Press platform.
Data correspond to usage on the plateform after 2015. The current usage metrics is available 48-96 hours after online publication and is updated daily on week days.
Initial download of the metrics may take a while.