Fig. 1
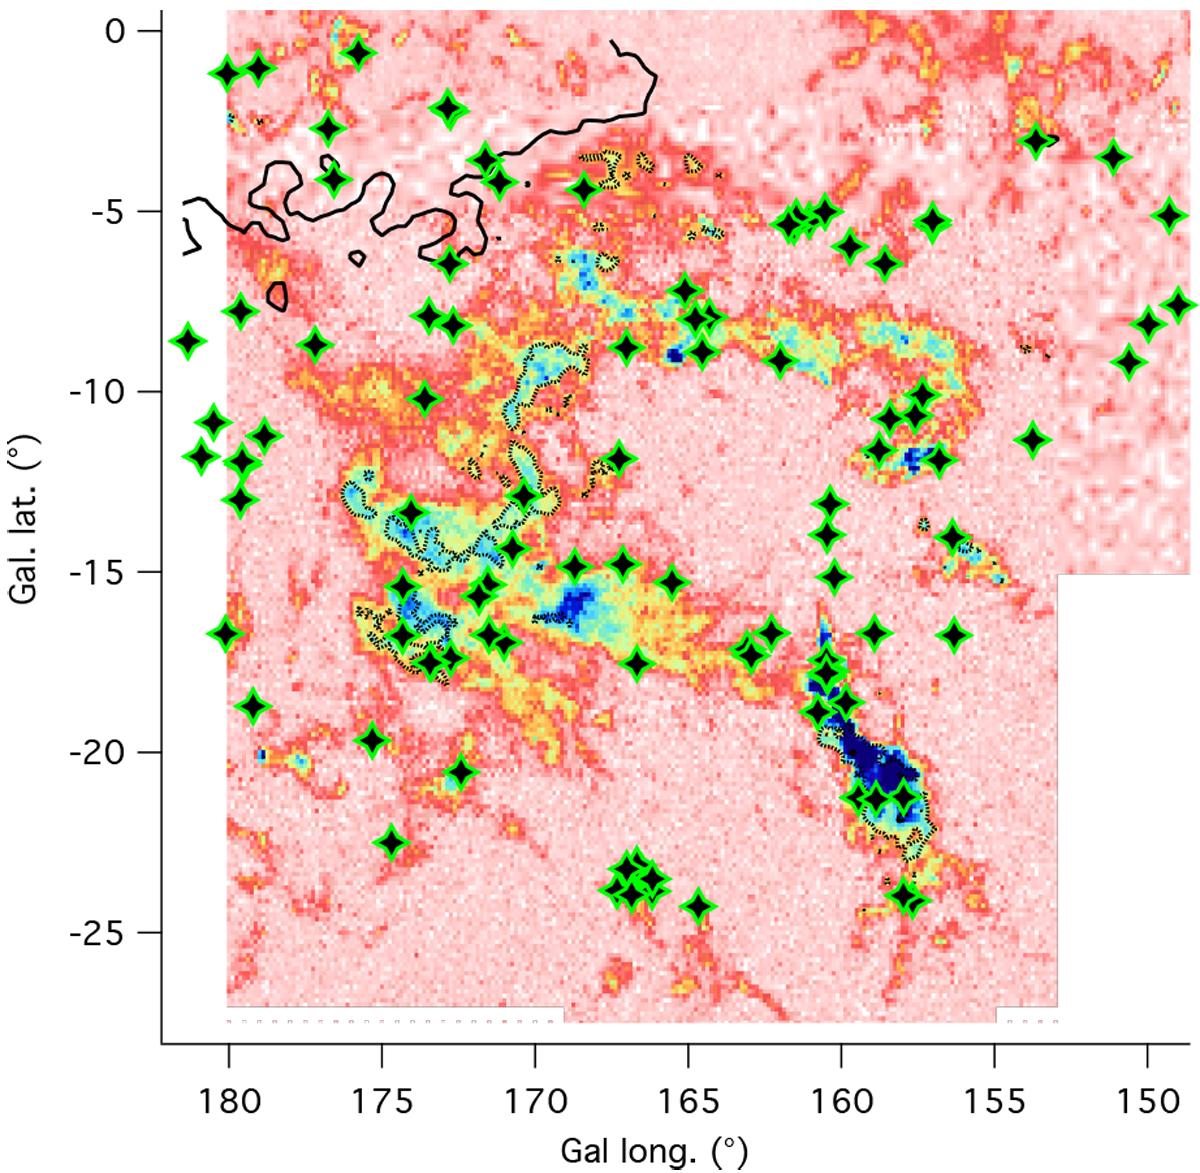
Target stars from our program and from archives superimposed on a 12CO map of the Taurus-Perseus-California area (Dame et al. 2001). Superimposed are HI iso-contours for T(HI) = 1, 2, and 3.5 K (thin, dot-dashed, and thick line lines, respectively), based on HI4PI Collaboration (2016) data. Both CO and HI columns were restricted to LSR velocities between −10 and +10 km s−1.
Current usage metrics show cumulative count of Article Views (full-text article views including HTML views, PDF and ePub downloads, according to the available data) and Abstracts Views on Vision4Press platform.
Data correspond to usage on the plateform after 2015. The current usage metrics is available 48-96 hours after online publication and is updated daily on week days.
Initial download of the metrics may take a while.