Fig. 4
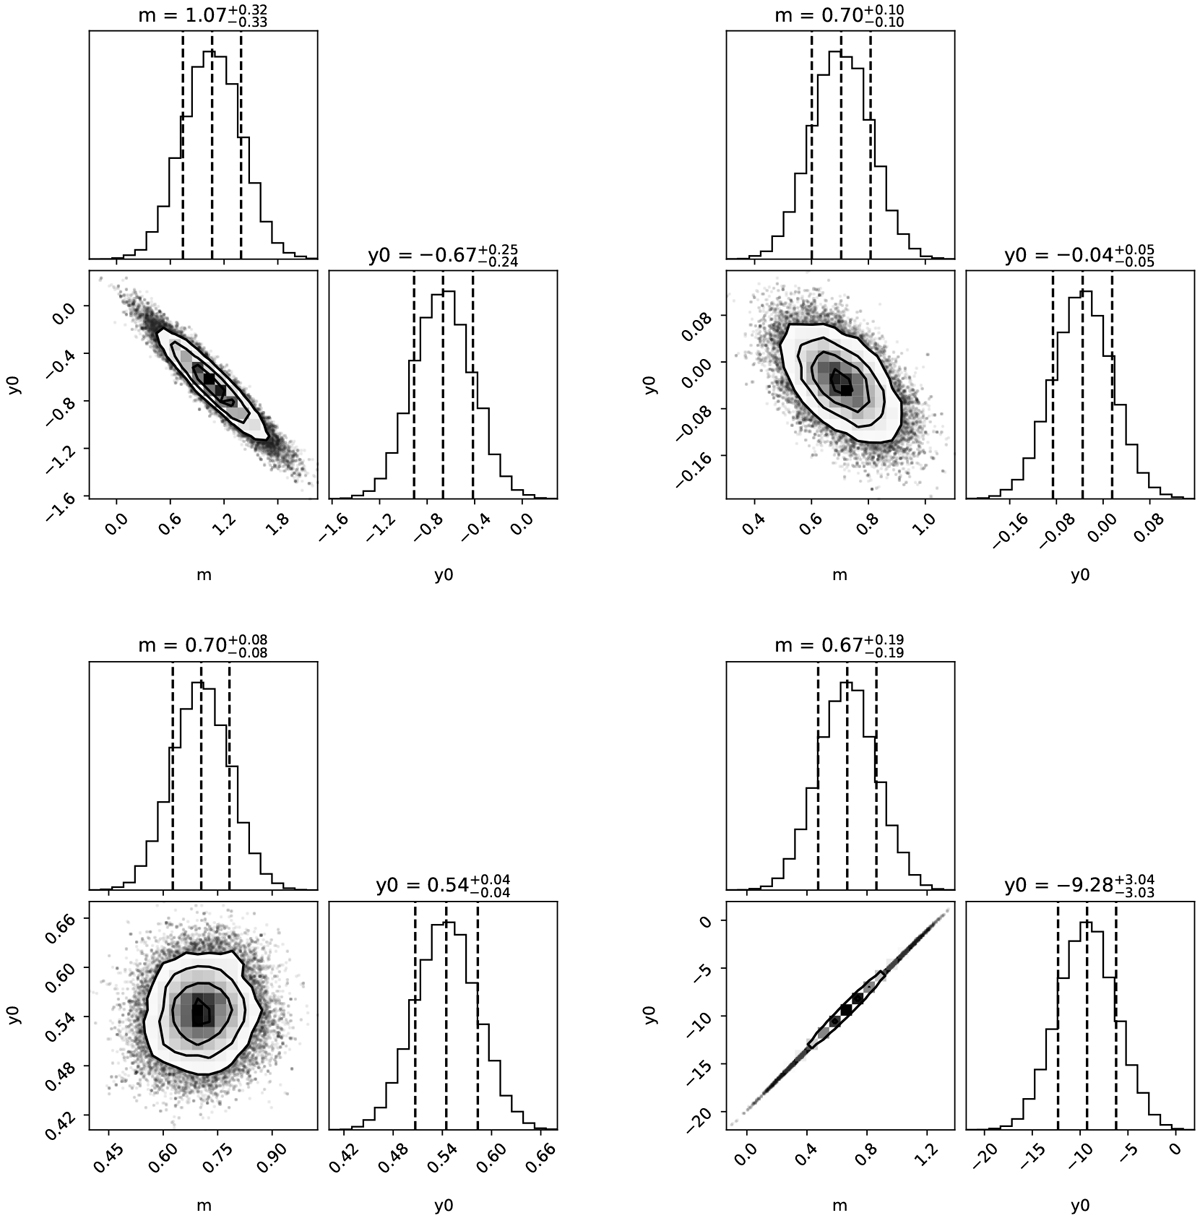
Posterior distributions for the slope (m) and the intercept (y0) for the different correlations explored in the logarithmic space. From left to right and top to bottom: correlations are: H2S vs. CS, H2S vs. H2CO, CS vs. H2CO, and H2S vs. H2O. The verticaldashed lines represent the 16th, 50th, and 84th percentiles. The plots were generated using the PYTHON module CORNER (Foreman-Mackey 2016).
Current usage metrics show cumulative count of Article Views (full-text article views including HTML views, PDF and ePub downloads, according to the available data) and Abstracts Views on Vision4Press platform.
Data correspond to usage on the plateform after 2015. The current usage metrics is available 48-96 hours after online publication and is updated daily on week days.
Initial download of the metrics may take a while.