Fig. 3
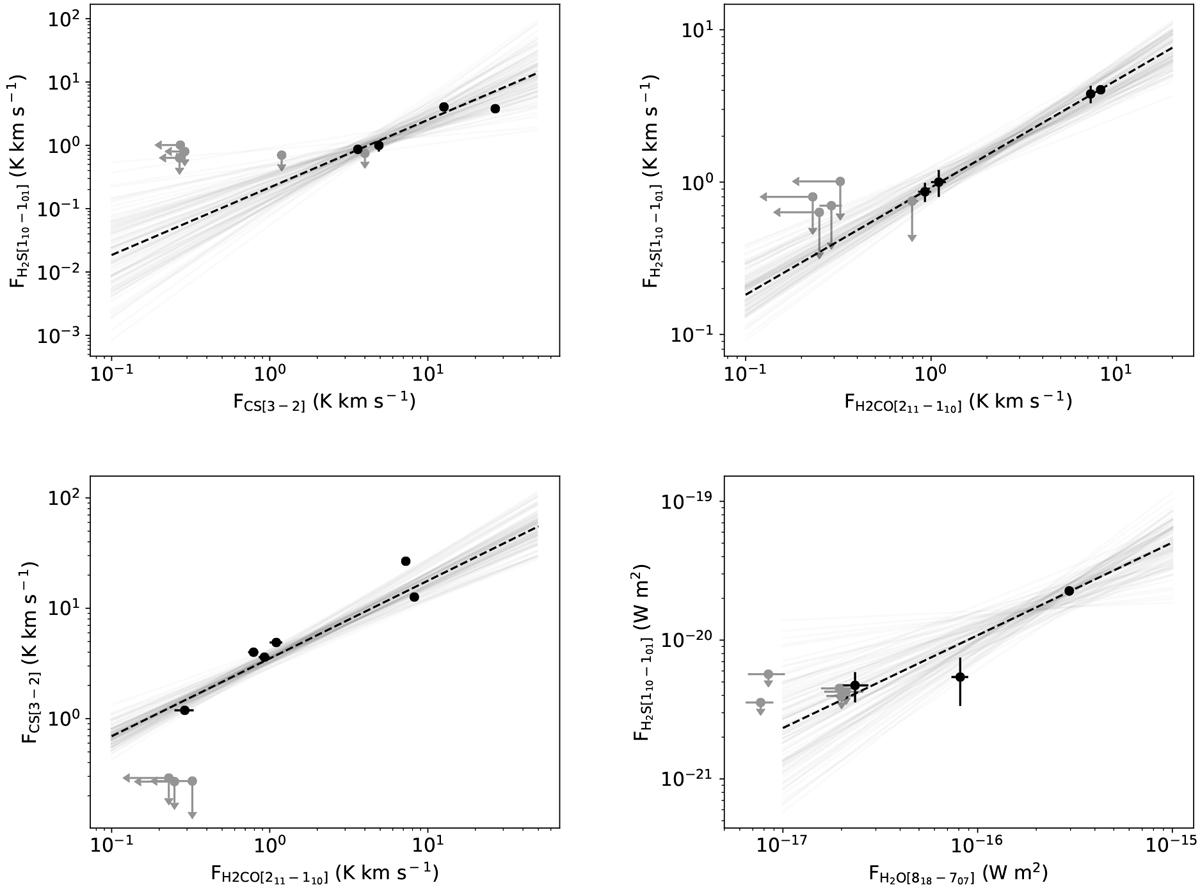
Correlations between line fluxes of the different lines observed. Black dots show the position in the diagrams of detected sources, while gray arrows show the position of upper limits. The dashed black line in each plot depicts a linear fit to logarithmic-scale data. The gray lines show a random selection of 100 models drawn from the obtained posterior distributions. The line fluxes have been normalized to the distance to Taurus (140 pc) to take the dispersion in distances among Taurus members into account.
Current usage metrics show cumulative count of Article Views (full-text article views including HTML views, PDF and ePub downloads, according to the available data) and Abstracts Views on Vision4Press platform.
Data correspond to usage on the plateform after 2015. The current usage metrics is available 48-96 hours after online publication and is updated daily on week days.
Initial download of the metrics may take a while.