Fig. 4.
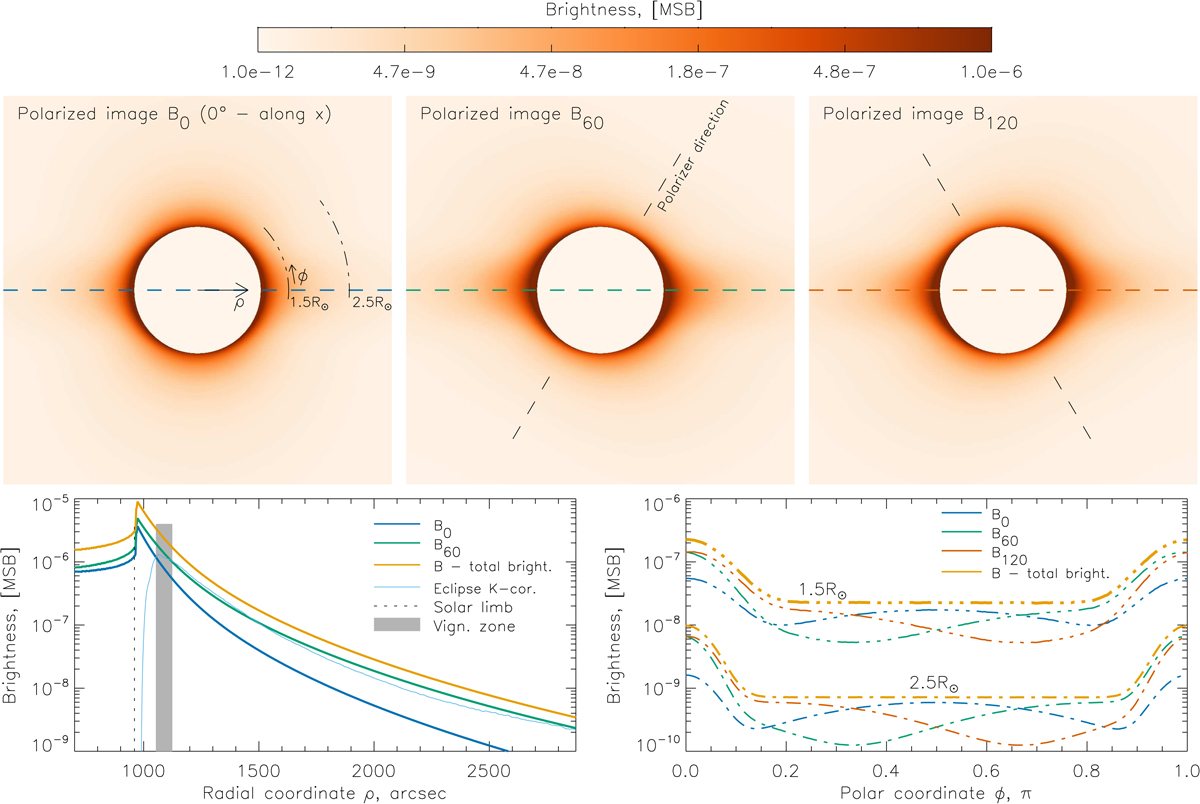
Polarized images. Top panels: calculated images B0, B60, and B120 denoting the corona observed with different orientations of the polarizers. The logarithmic color scale corresponds to the scale from Fig. 2. Bottom panels: radial (left) and polar (right) profiles. For reference, we plot the total brightness B, as well as the brightness of the eclipse K corona, the solar limb, and the vignetting zone.
Current usage metrics show cumulative count of Article Views (full-text article views including HTML views, PDF and ePub downloads, according to the available data) and Abstracts Views on Vision4Press platform.
Data correspond to usage on the plateform after 2015. The current usage metrics is available 48-96 hours after online publication and is updated daily on week days.
Initial download of the metrics may take a while.