Fig. 4.
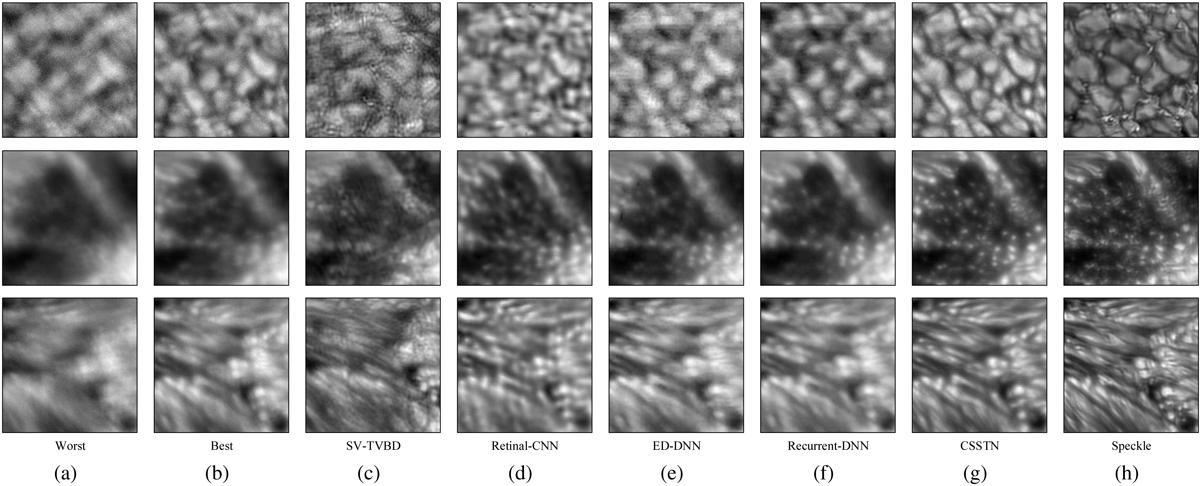
Detailed results of the subregions (the area of red rectangles in the first from top to bottom in Fig. 3a). The (a) column is the worst source image. The (b) column is the best source image. The images of (c) to (h) column are restored by corresponding labeled methods. Image size is 256 × 256 with 8.832 arcsec × 8.832 arcsec.
Current usage metrics show cumulative count of Article Views (full-text article views including HTML views, PDF and ePub downloads, according to the available data) and Abstracts Views on Vision4Press platform.
Data correspond to usage on the plateform after 2015. The current usage metrics is available 48-96 hours after online publication and is updated daily on week days.
Initial download of the metrics may take a while.