Fig. 2
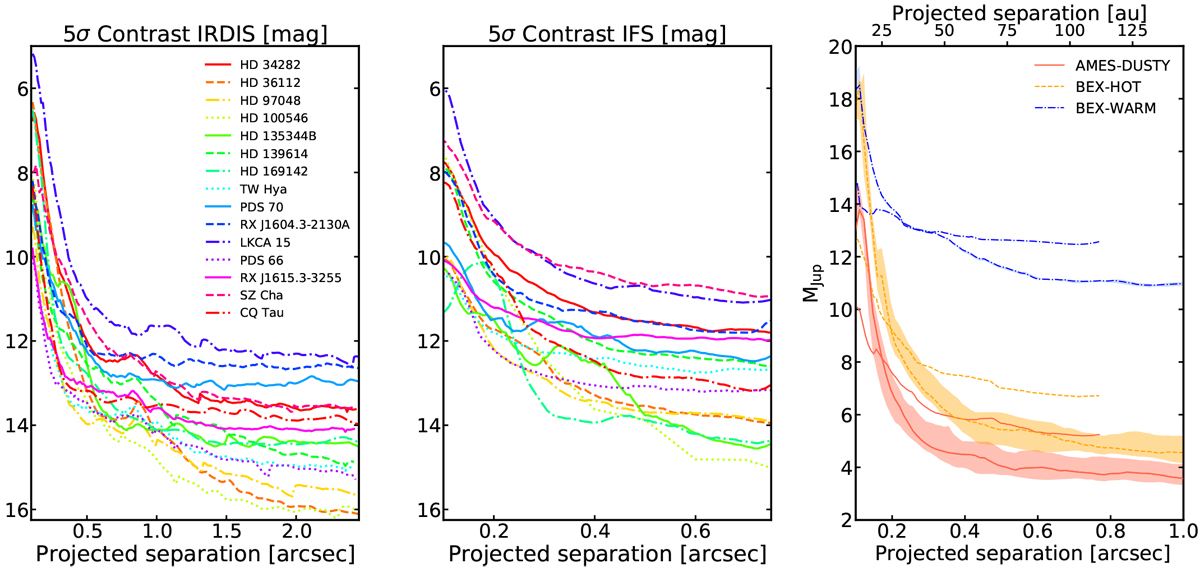
Left: SPHERE 1D projected contrast curves for ANDROMEDA/IRDIS data in the H2, K1, or Ks filter, depending on the observing mode given in Table 2. The results are shown down to the edge of the coronagraph(~100 mas). Centre: corresponding ASDI/IFS magnitude limits for the inner regions. Right: median mass detection limits assuming the initial luminosities given by the AMES-DUSTY, BEX-HOT, and BEX-WARM models. To convert the semi-major axis to au, a median distance was adopted in our sample of ~145 pc. Thick curves correspond to the ANDROMEDA/IRDIS performance, while the shaded areas show the median sensitivities for the upper and lower limits on the age of the companions. ASDI/IFS mass limits are shown in the same curve style up to ~0.8′′. Individual deprojected detection limits are given in Appendix B.
Current usage metrics show cumulative count of Article Views (full-text article views including HTML views, PDF and ePub downloads, according to the available data) and Abstracts Views on Vision4Press platform.
Data correspond to usage on the plateform after 2015. The current usage metrics is available 48-96 hours after online publication and is updated daily on week days.
Initial download of the metrics may take a while.