Fig. B.1
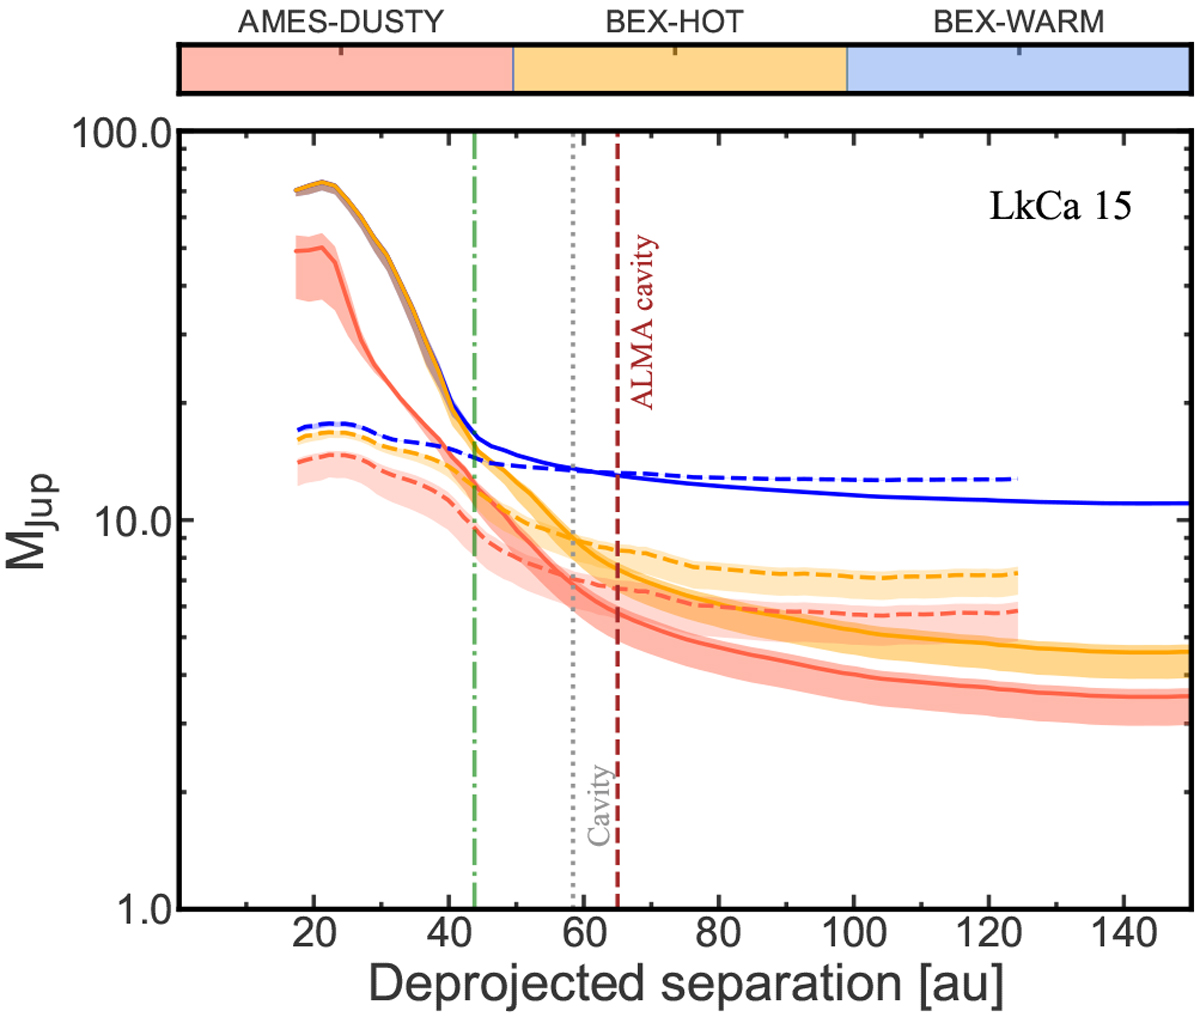
5σ sensitivity to planet masses in LkCa 15. The different initial luminosities for the derived age in Table 1are shown as red, orange, and blue curves respectively for the AMES-DUSTY, BEX-HOT, and BEX-WARM models. Thick curves correspond to the ANDROMEDA IRDIS limits, and dashed curves show the IFS-ASDI performance using the SPHERE mode in Table 2. The shaded regions encompass the upper and lower limits of the age uncertainty. SPHERE PDI substructures are shown in grey as vertical dotted lines, and the observed peaks in ALMA dust continuum are shown as brown dashed lines. Only ALMA rings with correspondence to scattered-light substructures are shown. The green dash-dotted vertical lines indicate reported gap locations in PDI.
Current usage metrics show cumulative count of Article Views (full-text article views including HTML views, PDF and ePub downloads, according to the available data) and Abstracts Views on Vision4Press platform.
Data correspond to usage on the plateform after 2015. The current usage metrics is available 48-96 hours after online publication and is updated daily on week days.
Initial download of the metrics may take a while.