Fig. 1
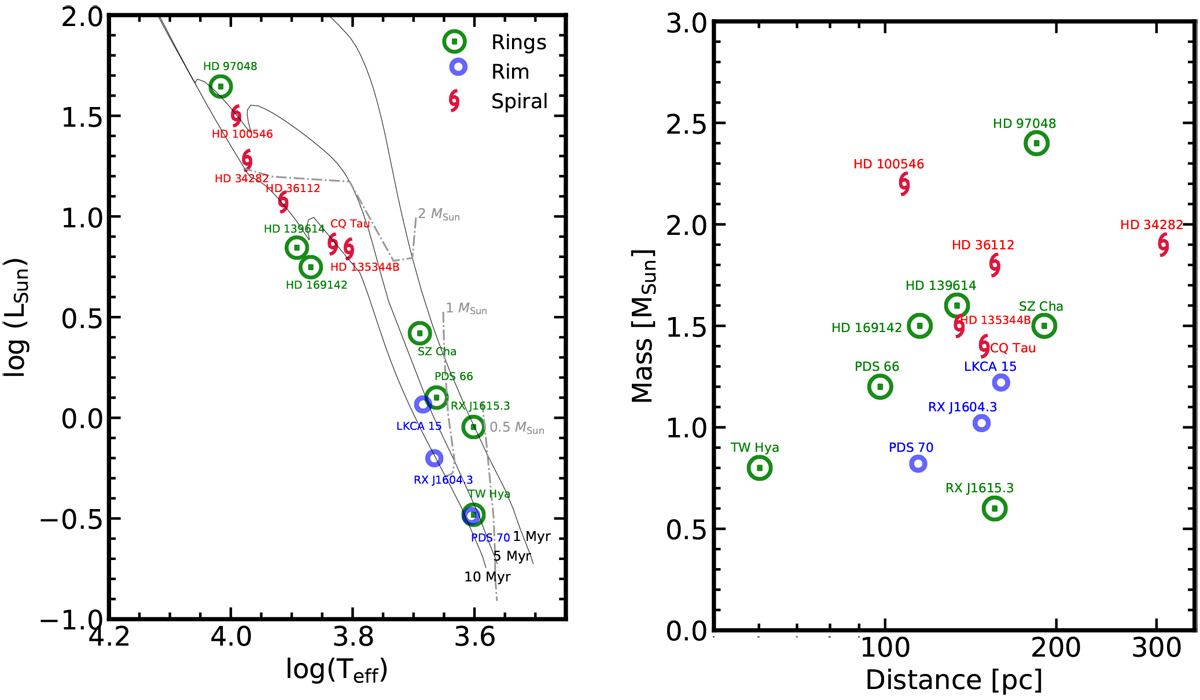
Left: Hertzsprung–Russell diagram of the PPD hosts in our sample. They are classified into Rings, Rim, or Spiral based on their main detected substructures; the MIST tracks for young PMS stars are overplotted (Choi et al. 2016). The resulting stellar parameters are shown in Table 1 and have been derived as explained in Sect. 2.1. Right: mass–distance diagram of the same population.
Current usage metrics show cumulative count of Article Views (full-text article views including HTML views, PDF and ePub downloads, according to the available data) and Abstracts Views on Vision4Press platform.
Data correspond to usage on the plateform after 2015. The current usage metrics is available 48-96 hours after online publication and is updated daily on week days.
Initial download of the metrics may take a while.