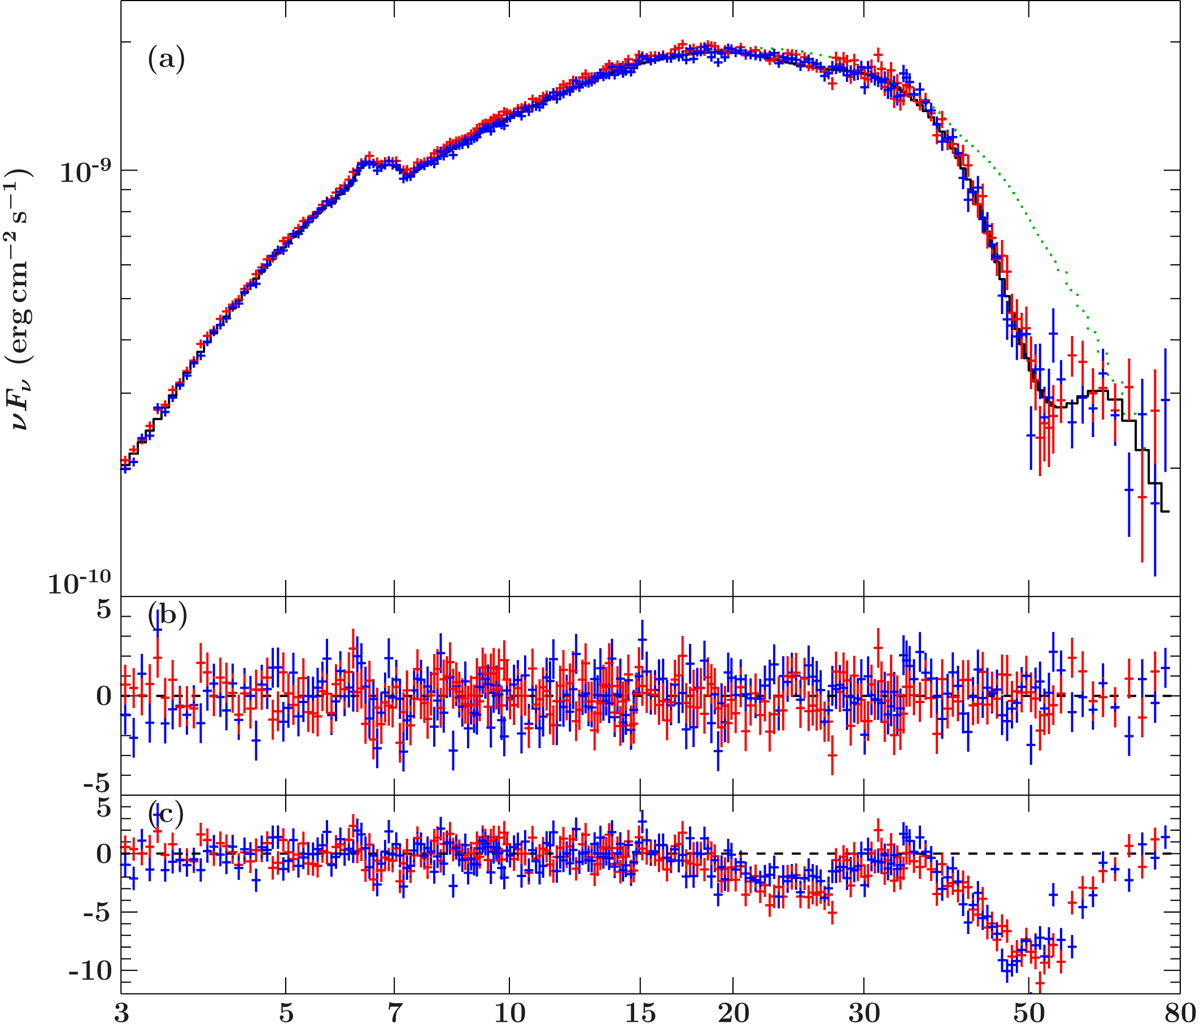
Fig. 7.

a: X-ray spectrum of Vela X-1 as measured with NuSTAR (ObsID 30002007003). Data from the two instruments of NuSTAR, FPMA and FPMB, are shown in red and blue, respectively. The best-fit model as presented by Fürst et al. (2014) is shown in black. The dashed green lines indicates the continuum model without the CRSF components. b: residuals in terms of χ2 between the data and the best-fit model. c: residuals between the data and the model without the CRSF components. The harmonic line around 55 keV is much more prominent than the fundamental line around 25 keV.
Current usage metrics show cumulative count of Article Views (full-text article views including HTML views, PDF and ePub downloads, according to the available data) and Abstracts Views on Vision4Press platform.
Data correspond to usage on the plateform after 2015. The current usage metrics is available 48-96 hours after online publication and is updated daily on week days.
Initial download of the metrics may take a while.


