Fig. 6.
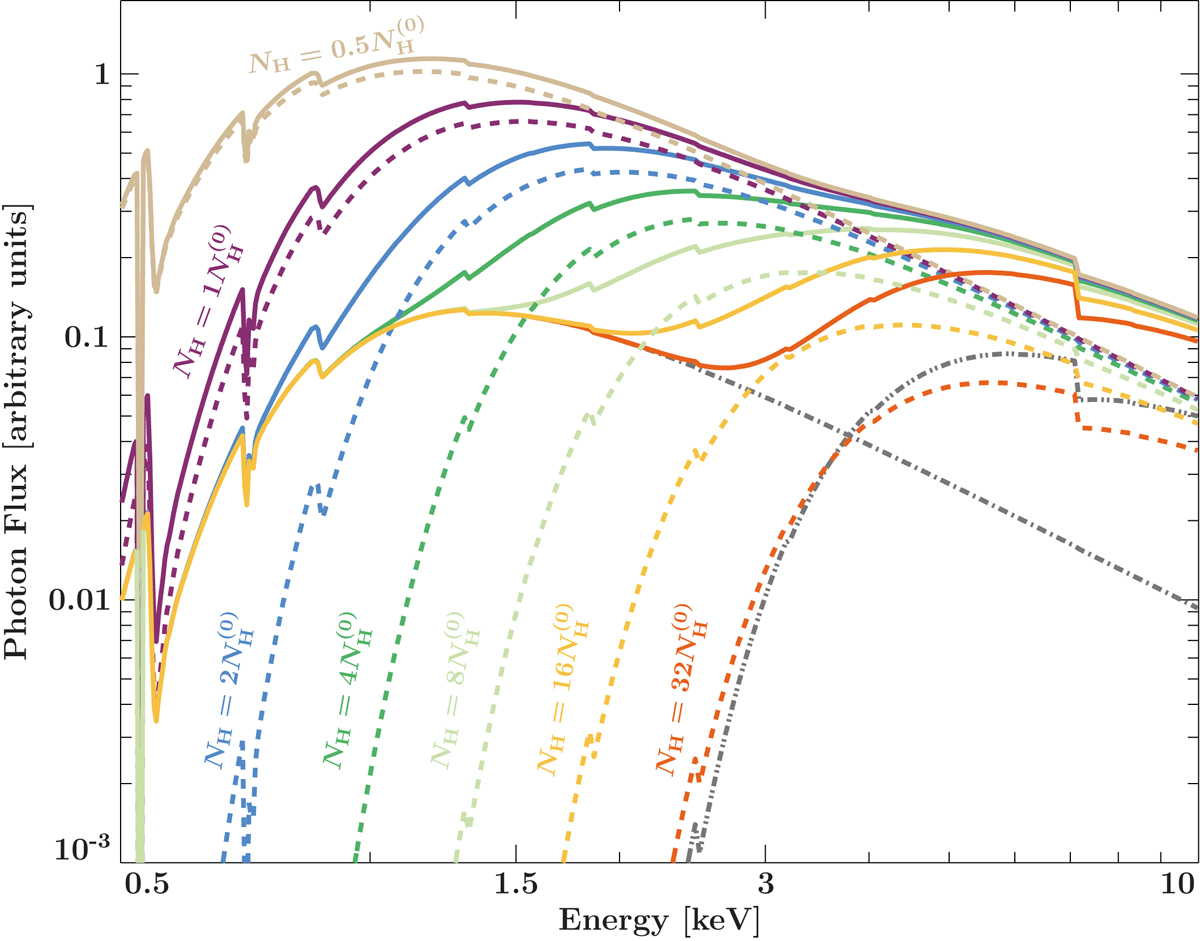
Effect of variable absorption on the overall shape of the spectrum of Vela X-1 in the 0.5–10 keV range. Following Martínez-Núñez et al. (2014), we assume a spectral model consisting of three power-law components with the same slope, but different normalizations, each absorbed by a different absorption component. In accordance with trends seen by Martínez-Núñez et al. (2014), we then vary the total amount of absorption that the second of these power-law components experiences. The dot-dashed gray line shows the first power-law component. The dashed lines show the second power-law component, and different colors represent different absorption strengths, as indicated in the plot. The dot-dot-dashed line shows the third power-law component. The sum of the three components, i.e., the total spectrum, is shown as solid lines, and colors again represent different absorption levels for the second component.
Current usage metrics show cumulative count of Article Views (full-text article views including HTML views, PDF and ePub downloads, according to the available data) and Abstracts Views on Vision4Press platform.
Data correspond to usage on the plateform after 2015. The current usage metrics is available 48-96 hours after online publication and is updated daily on week days.
Initial download of the metrics may take a while.