Fig. 5.
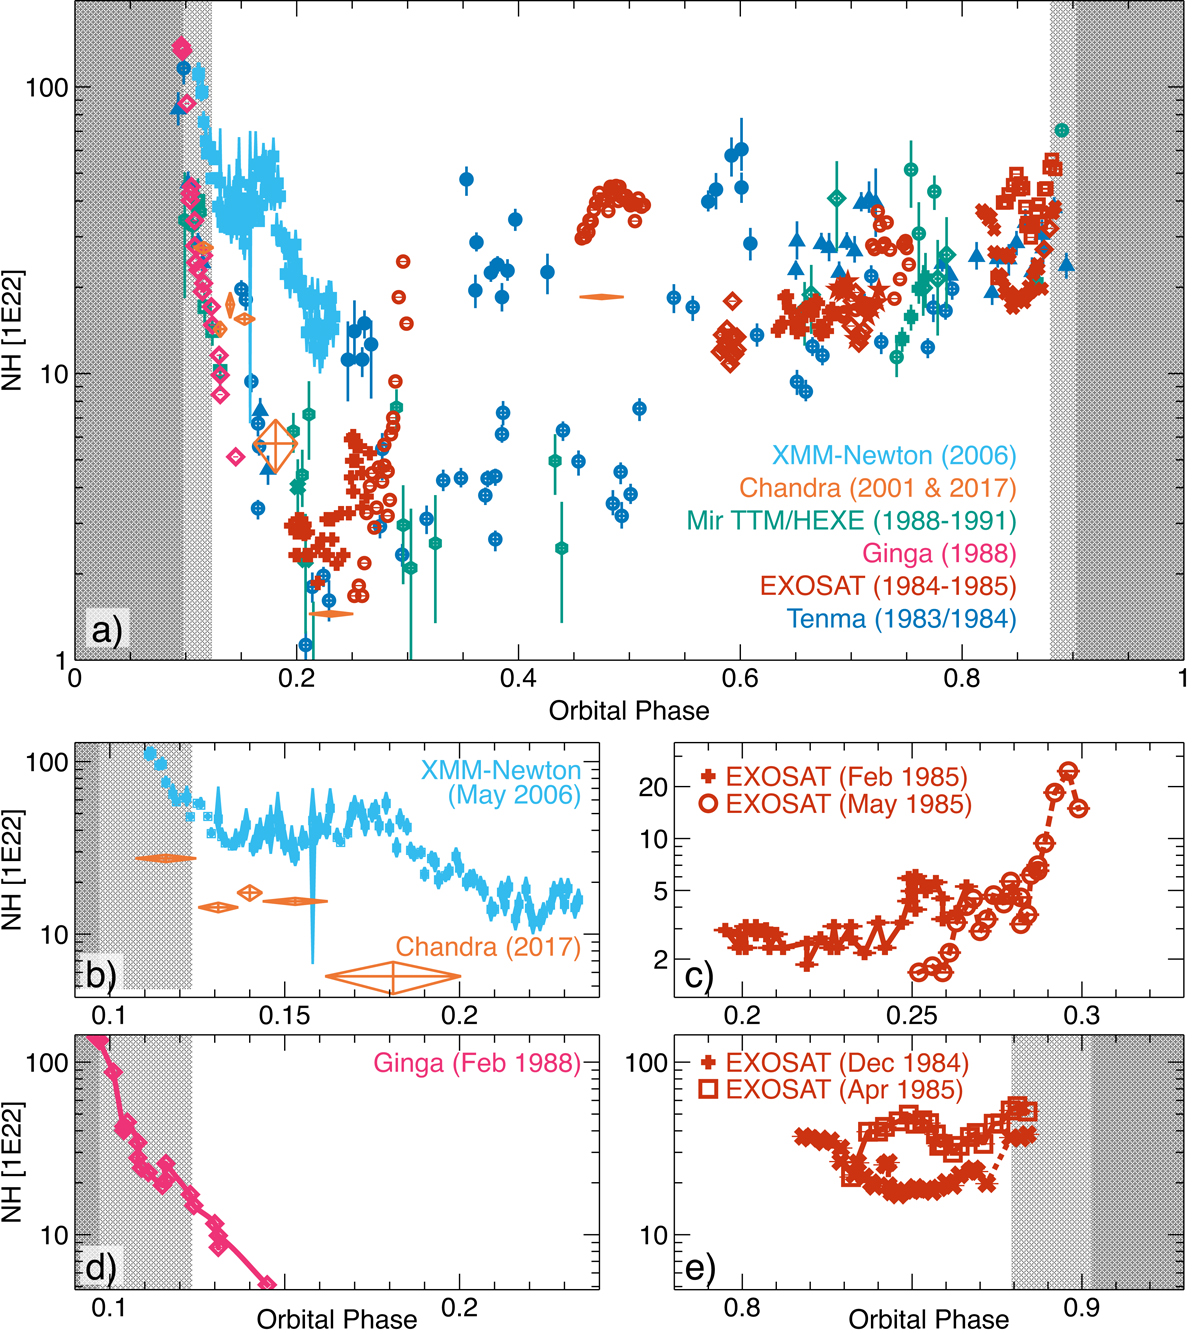
Variations in derived absorbing column density (NH/cm2) throughout the binary orbit of Vela X-1 as determined by various observations and different satellites. See the text for caveats when absolute values in NH are compared. The shaded gray areas mark the eclipse (dark gray) and the ingress and egress (light gray) as determined by Sato et al. (1986). Binary phase values have been corrected for the differences in phase-zero definition (using Tecl) and orbital period relative to Kreykenbohm et al. (2008). The uncertainty in this conversion is 1–4 × 10⁻³ in phase, i.e., usually within the symbol size. Care has been taken to separate measurements taken during different binary orbits by the same instrument and team. Where possible, this is marked by different symbols. The data have been taken from Sato et al. (1986, Fig. 5 (Tenma)), Haberl & White (1990, Fig. 2 (EXOSAT)), Lewis et al. (1992, Fig. 2 (Ginga)), Pan et al. (1994, Fig. 3 (TTM/HEXE)), Watanabe et al. (2006, Table 2 (Chandra 2001)), Martínez-Núñez et al. (2014, Fig. 7 (XMM-Newton)) and Liao et al. (2020, Table 1 (Chandra 2017)). Panel a: an overview of the overall distribution, demonstrating the large scatter of results at intermediate orbital phases and that the larger structures driving NH are not stable from one orbit to the next (see also Malacaria et al. 2016). Panels b–e: subsets of the data in more detail to better visualize short-term variations. In all these panels, the X-axis covers the same range, and the Y-axis covers the same factor between minimum and maximum.
Current usage metrics show cumulative count of Article Views (full-text article views including HTML views, PDF and ePub downloads, according to the available data) and Abstracts Views on Vision4Press platform.
Data correspond to usage on the plateform after 2015. The current usage metrics is available 48-96 hours after online publication and is updated daily on week days.
Initial download of the metrics may take a while.