Fig. 4.
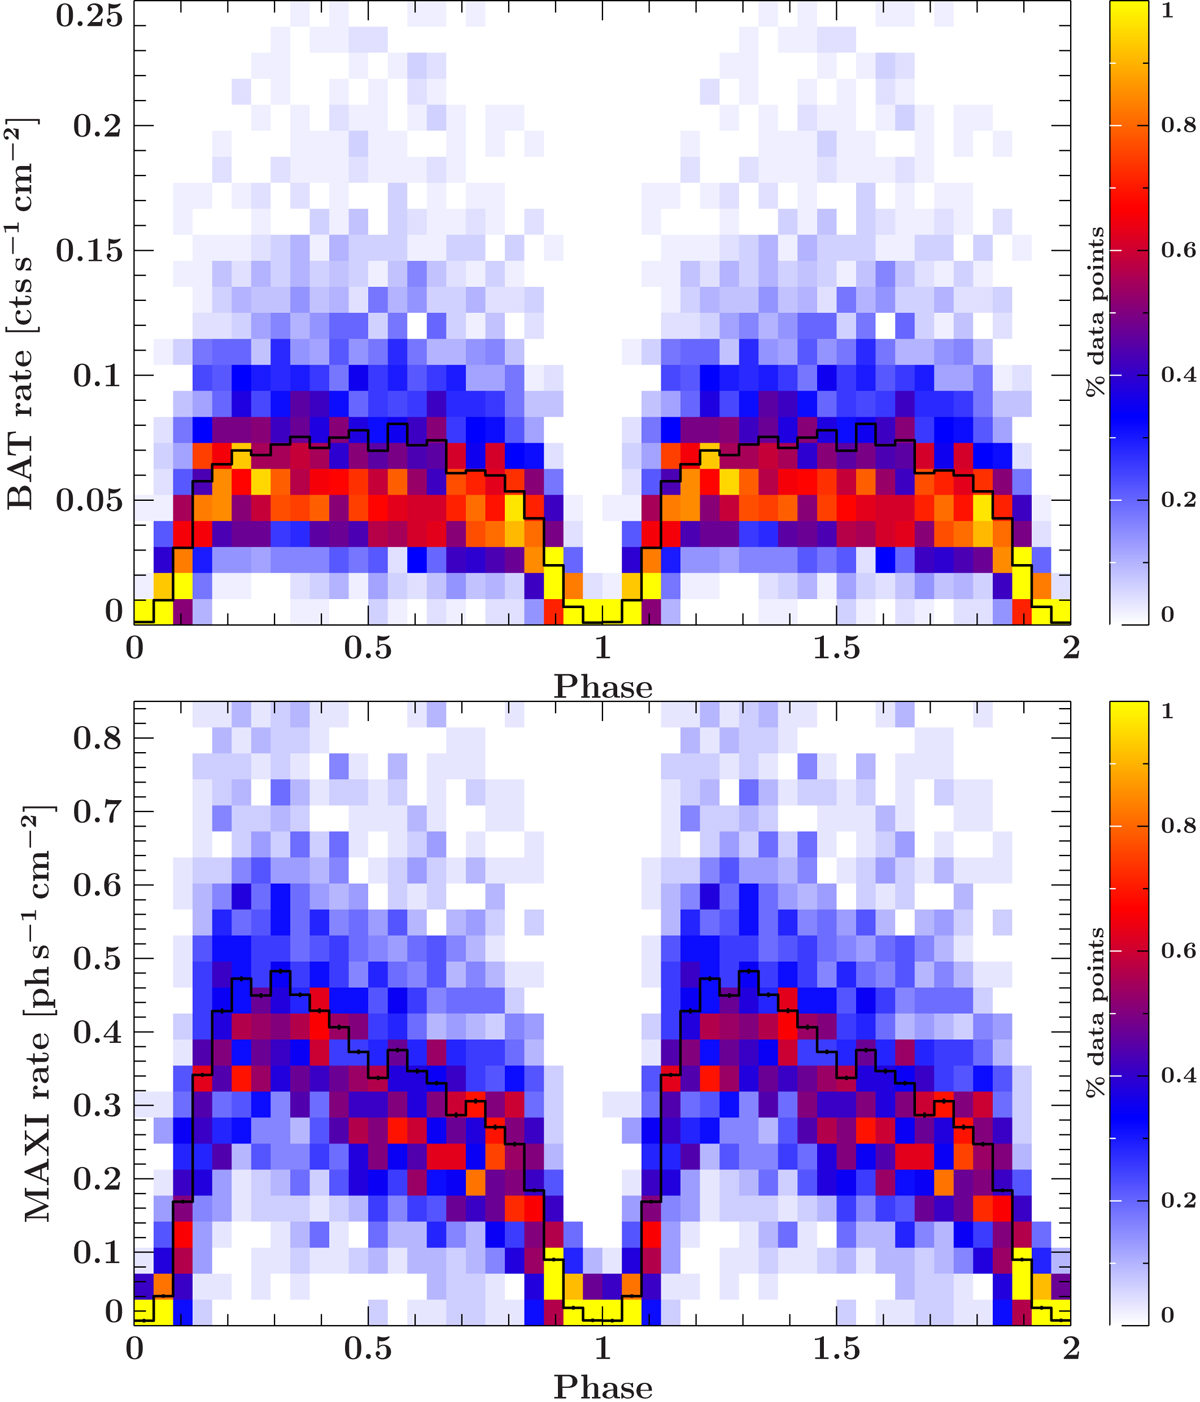
Brightness distribution of Vela X-1 throughout its orbit as measured with Swift/BAT (15–50 keV, top panel) and MAXI (2–20 keV, bottom panel). In comparison, 1 Crab corresponds to values ∼0.22 for Swift/BAT and ∼4 for MAXI. We used the full history for each instrument, binned to a resolution of 1 d. The mean orbital flux profile is superimposed in black. The probability for a measurement to fall into the respective histogram bin is color-coded according to the color scales on the right. The profile is repeated once for clarity. For details, see text.
Current usage metrics show cumulative count of Article Views (full-text article views including HTML views, PDF and ePub downloads, according to the available data) and Abstracts Views on Vision4Press platform.
Data correspond to usage on the plateform after 2015. The current usage metrics is available 48-96 hours after online publication and is updated daily on week days.
Initial download of the metrics may take a while.