Fig. 8.
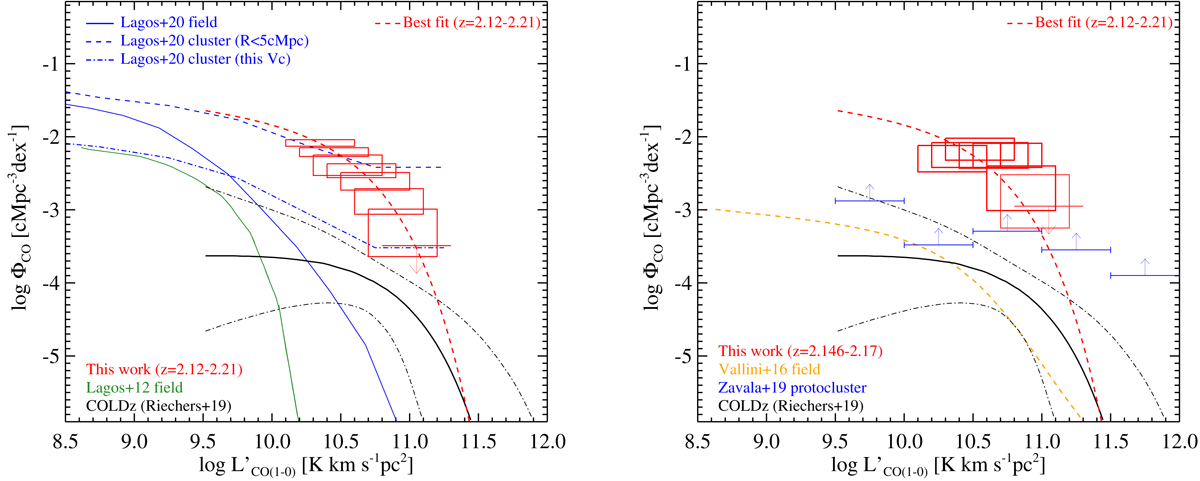
CO(1−0) luminosity functions for the Spiderweb protocluster and samples from the literature. Left: CO(1−0) luminosity density in each luminosity bin at z = 2.12 − 2.21 in this work, compared with the results at z ∼ 2 from the COLDz (Riechers et al. 2019) and predictions from semi-analytic SHARK models (Lagos et al. 2012, 2020). The dotted-dashed black lines mark the fifth and 95th percentiles of the COLDz luminosity function. The red dashed curve shows the best fit to our data. We show CO luminosity functions for protoclusters derived from SHARK models within two different volumes. One (blue dashed curve) is calculated in a spherical volume with radius R < 5 cMpc and the other one (blue dot-dashed curve) is in the identical volume to that where the observed CO luminosity function is measured, respectively. Right: same as the left panel, but boxes are shown for CO luminosity density in a narrow redshift range z = 2.146 − 2.17. Blue arrows mark the lower limits for protoclusters in Zavala et al. (2019), and the orange curve shows the results from Vallini et al. (2016).
Current usage metrics show cumulative count of Article Views (full-text article views including HTML views, PDF and ePub downloads, according to the available data) and Abstracts Views on Vision4Press platform.
Data correspond to usage on the plateform after 2015. The current usage metrics is available 48-96 hours after online publication and is updated daily on week days.
Initial download of the metrics may take a while.