Fig. 7.
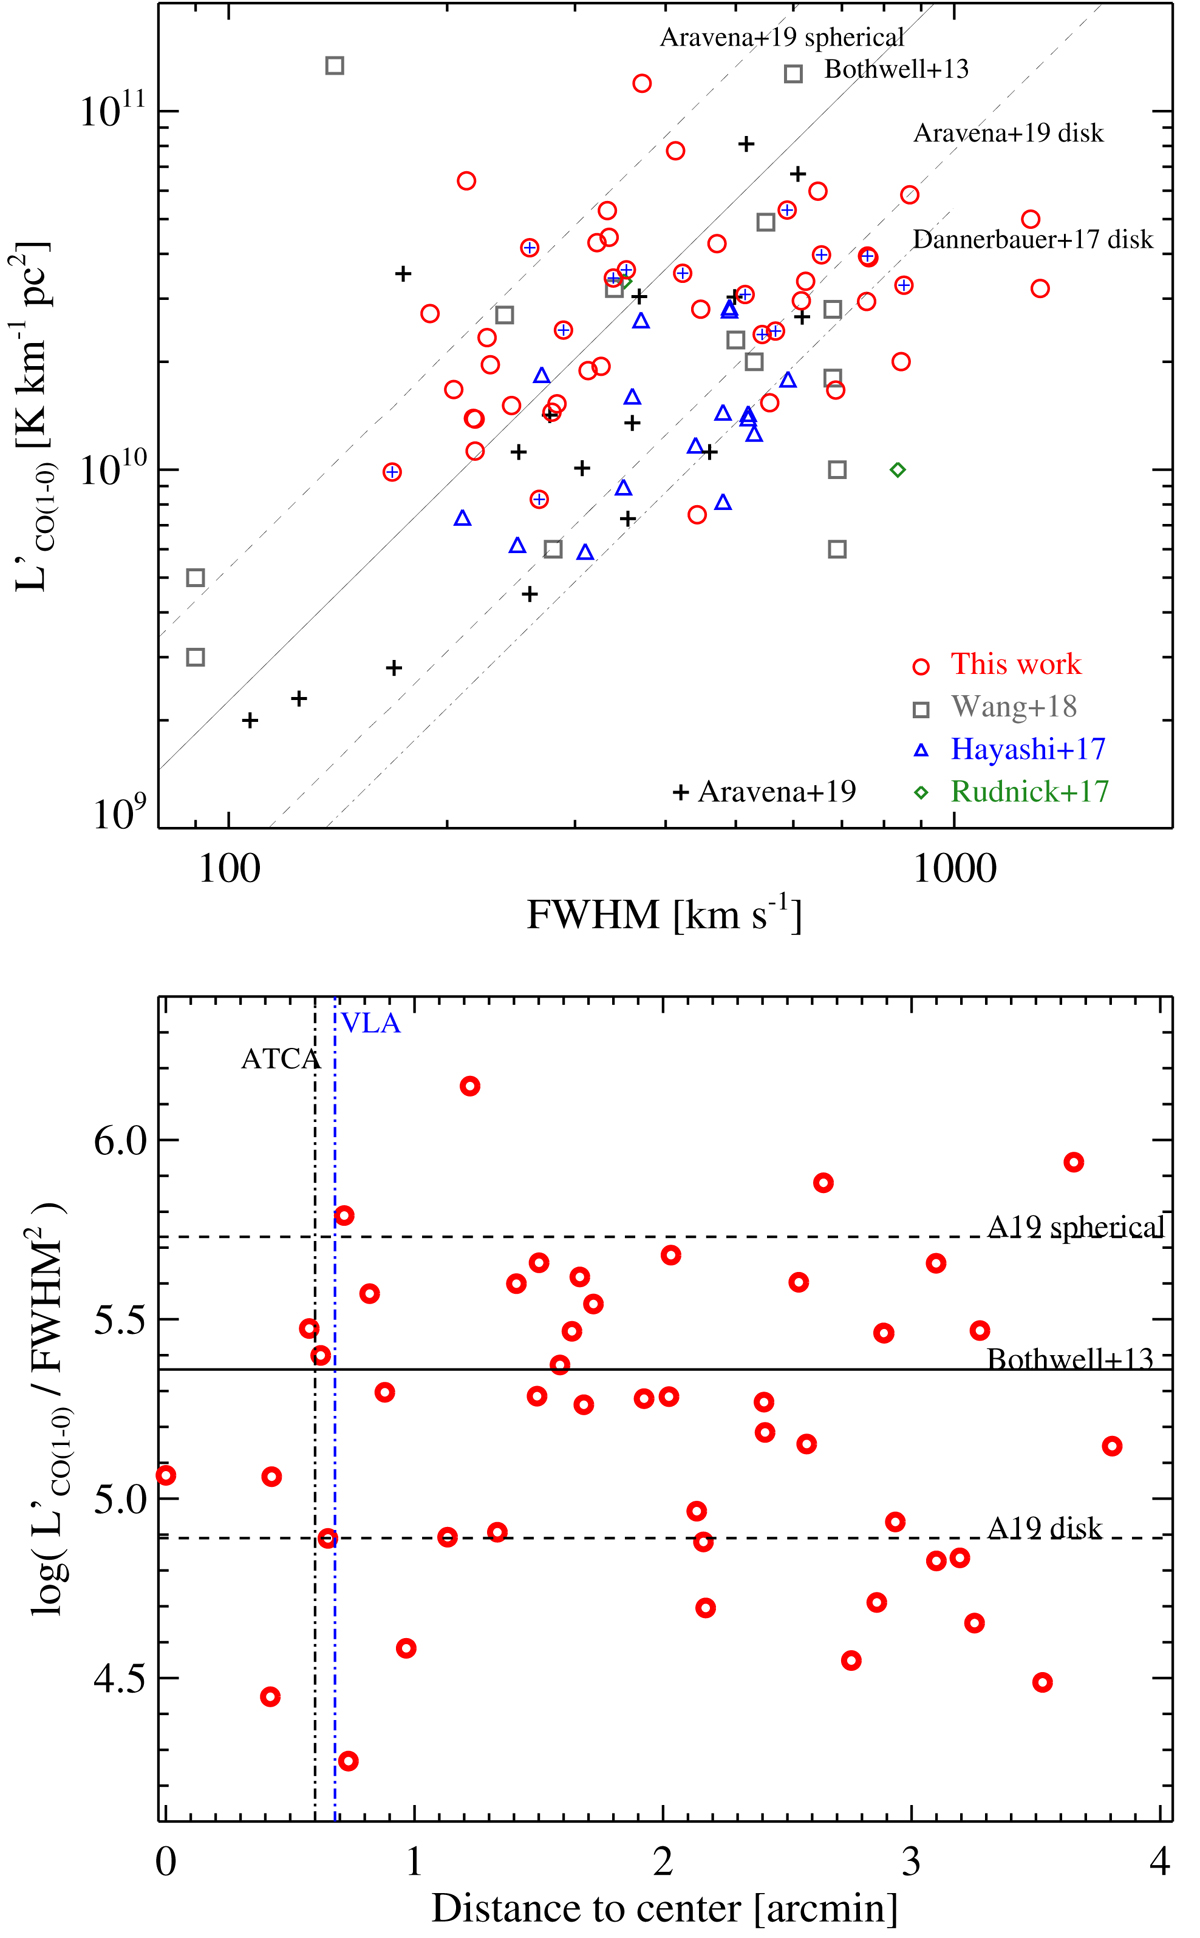
Top panel: CO luminosity versus FWHM. CO detections in this study are shown in red circles with HAEs marked by blue crosses. The dashed lines are from Aravena et al. (2019) where the upper line represents a spherical model and the bottom line a disk model. ASPECS galaxies (Aravena et al. 2019) are shown in black pluses, which lie mostly along the disk model line. The solid line shows the relation from Bothwell et al. (2013) and the dot dashed line presents the disk model from Dannerbauer et al. (2017). Bottom panel: CO luminosity normalized by FWHM2 versus distance from the center galaxy. Vertical lines mark the half FWHM of ATCA (black) and VLA (blue) primary beams, respectively. This figure shows that CO emitters in the Spiderweb protocluster are more likely to be starbursts (mergers) compared to other high-z clusters, and these starbursts are beyond the field of view (FoV) of the single pointing focusing on the central galaxy.
Current usage metrics show cumulative count of Article Views (full-text article views including HTML views, PDF and ePub downloads, according to the available data) and Abstracts Views on Vision4Press platform.
Data correspond to usage on the plateform after 2015. The current usage metrics is available 48-96 hours after online publication and is updated daily on week days.
Initial download of the metrics may take a while.