Fig. 6.
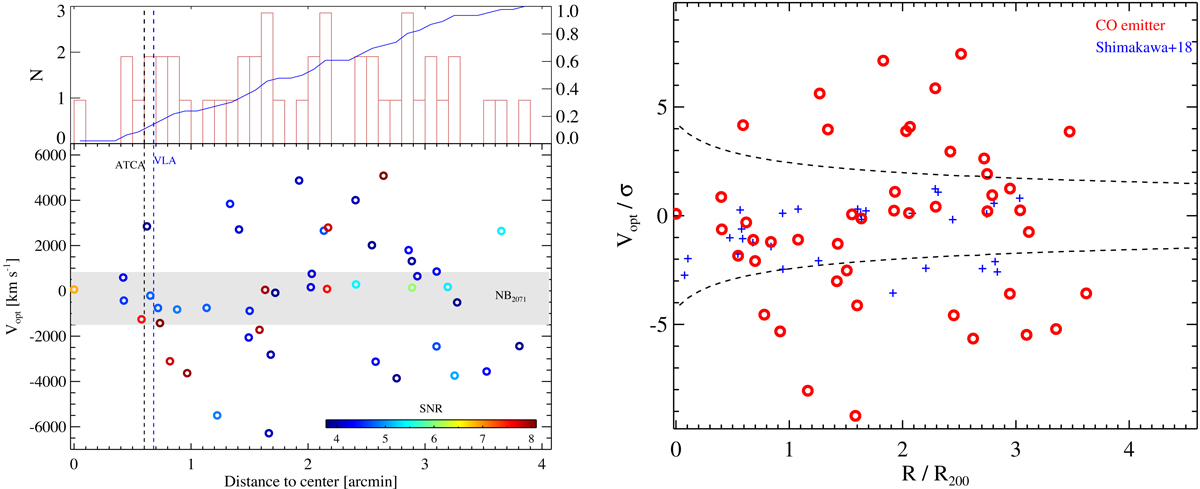
Left panel: distribution of CO emitters versus their sky distances from the central radio galaxy MRC1138−262. Top panel: histogram (red) and cumulative fraction (blue) of CO emitters as a function of the distances to the center galaxy. Bottom panel: CO emitters are color-coded with their S/N. Gray shaded area marks the redshift range observed by the narrow band N2071 (Shimakawa et al. 2018) of MOIRCS at Subaru. Blue and black dashed lines mark the field of view of VLA and ATCA single pointings, respectively. Right panel: normalized velocity versus distance to center galaxy for CO emitters in this study and HAEs with a spectroscopic redshift (Shimakawa et al. 2018). The normalization factors are σ = 683 km s−1 and R200 = 0.53 Mpc (Table 2 in Shimakawa et al. 2014). The two dashed curves show the escape velocity (positive and negative) as a function of distance from the cluster mass 1.71 × 10¹⁴ M⊙ (Shimakawa et al. 2014) using the prescription of Rhee et al. (2017). Half of the CO emitters in this work have velocities outside of the region enclosed by these two curves that are not expected to be gravitationally bound to the central mass.
Current usage metrics show cumulative count of Article Views (full-text article views including HTML views, PDF and ePub downloads, according to the available data) and Abstracts Views on Vision4Press platform.
Data correspond to usage on the plateform after 2015. The current usage metrics is available 48-96 hours after online publication and is updated daily on week days.
Initial download of the metrics may take a while.