Free Access
Fig. 5.
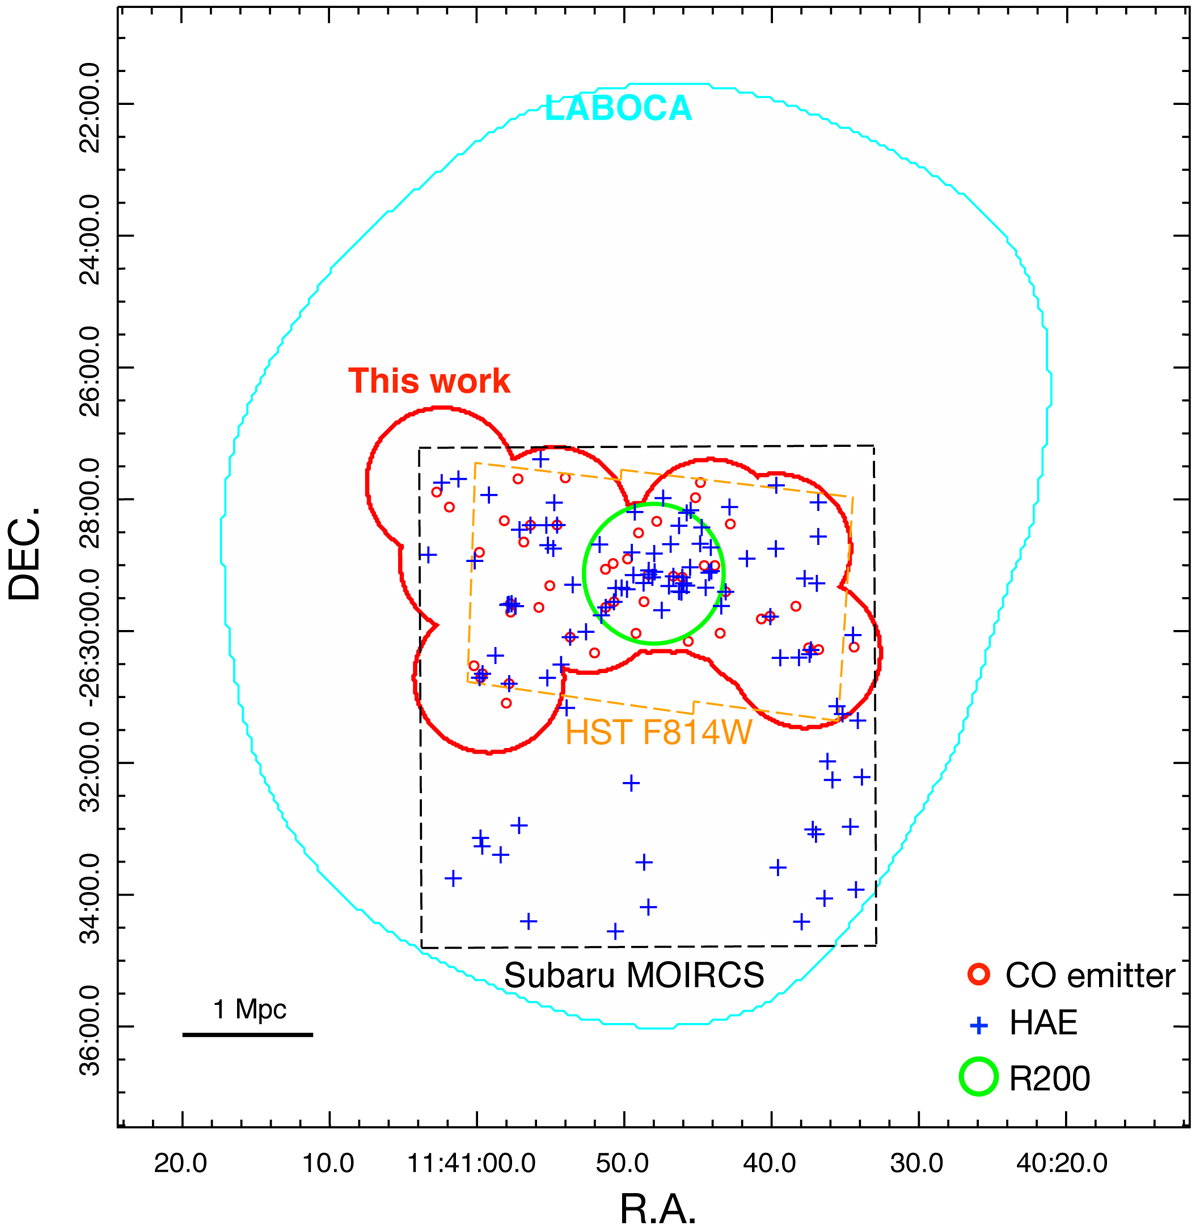
Footprints of this work and previous studies, overlaid by CO sources (red circles) in this work and HAEs (blue crosses) in Koyama et al. (2013) and Shimakawa et al. (2018). The R200 radius (Shimakawa et al. 2014) is shown in a green circle centering on the MRC1138−262.
Current usage metrics show cumulative count of Article Views (full-text article views including HTML views, PDF and ePub downloads, according to the available data) and Abstracts Views on Vision4Press platform.
Data correspond to usage on the plateform after 2015. The current usage metrics is available 48-96 hours after online publication and is updated daily on week days.
Initial download of the metrics may take a while.