Fig. 3.
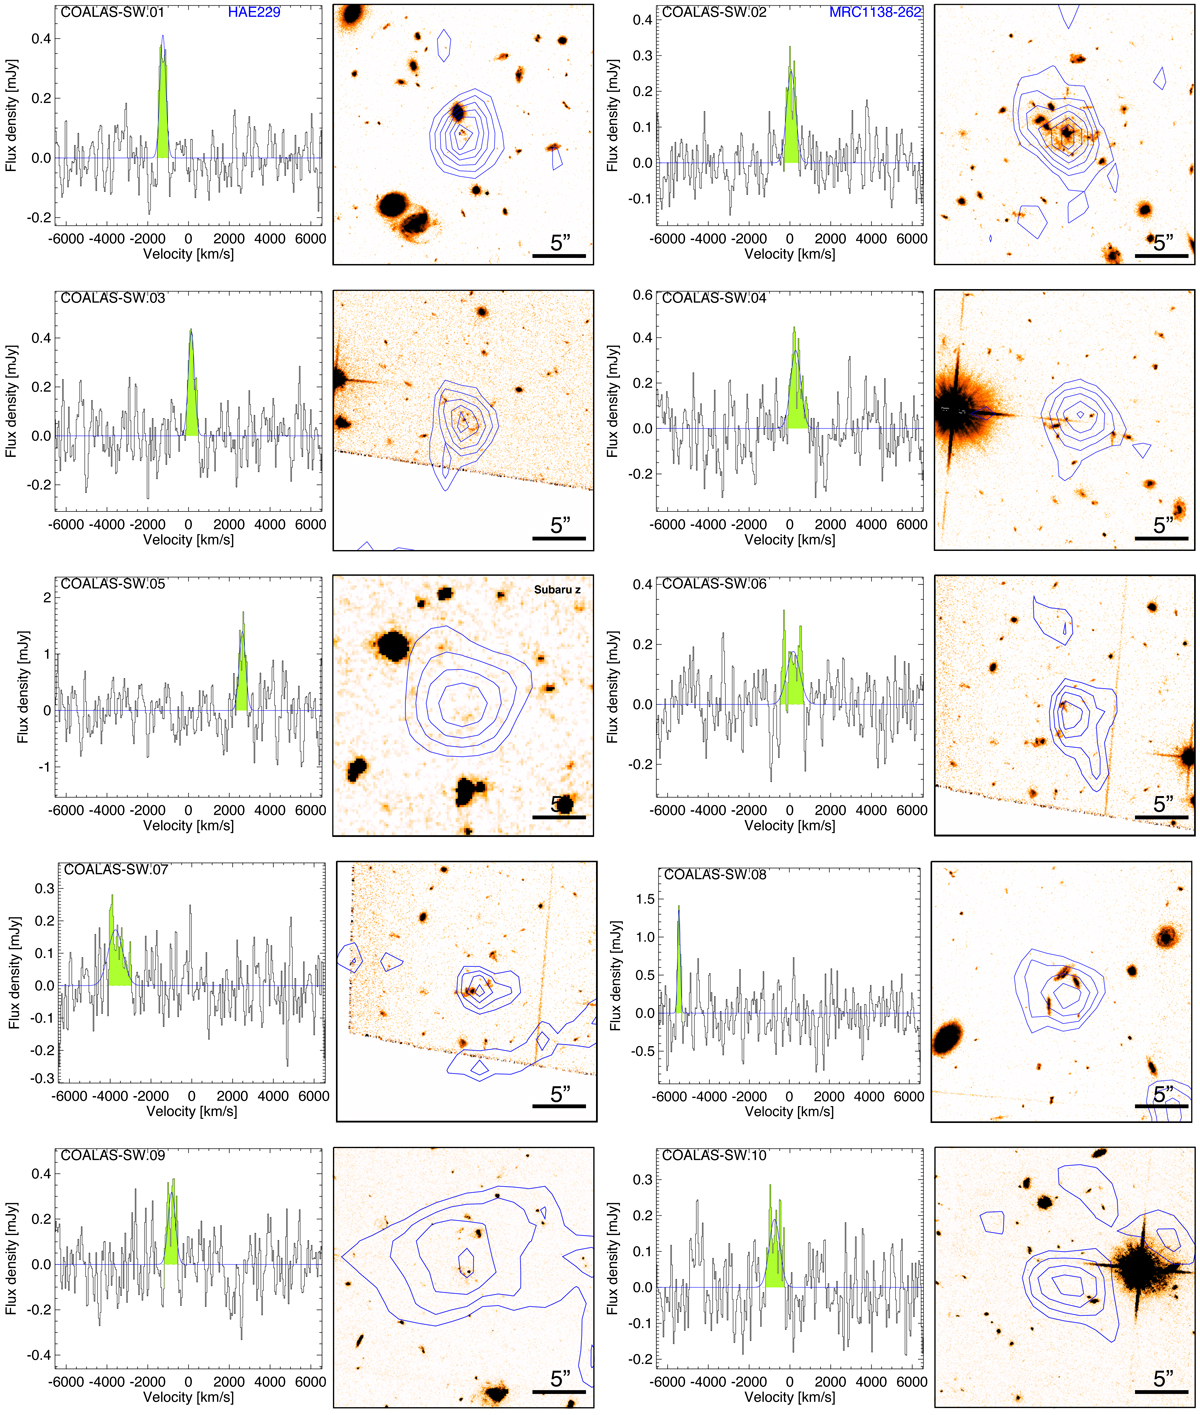
ATCA spectra and integrated CO maps for detections with S/N > 5. Spectra panels: CO(1−0) lines are highlighted in green and fit by a single Gaussian profile shown by a blue curve. Reference names in Emonts et al. (2016) and Dannerbauer et al. (2017) are highlighted in blue when available. Image panels: optical images of 25″ × 25″ in size overlaid with CO(1−0) intensity contours. In general, images are taken from the HST F814W data (Miley et al. 2006), while VLT Ks (Dannerbauer et al. 2014) and Subaru z-band images (Koyama et al. 2013) are indicated as text in the upper right corner. Contours start at 2σ in steps of 1σ.
Current usage metrics show cumulative count of Article Views (full-text article views including HTML views, PDF and ePub downloads, according to the available data) and Abstracts Views on Vision4Press platform.
Data correspond to usage on the plateform after 2015. The current usage metrics is available 48-96 hours after online publication and is updated daily on week days.
Initial download of the metrics may take a while.