Fig. 2.
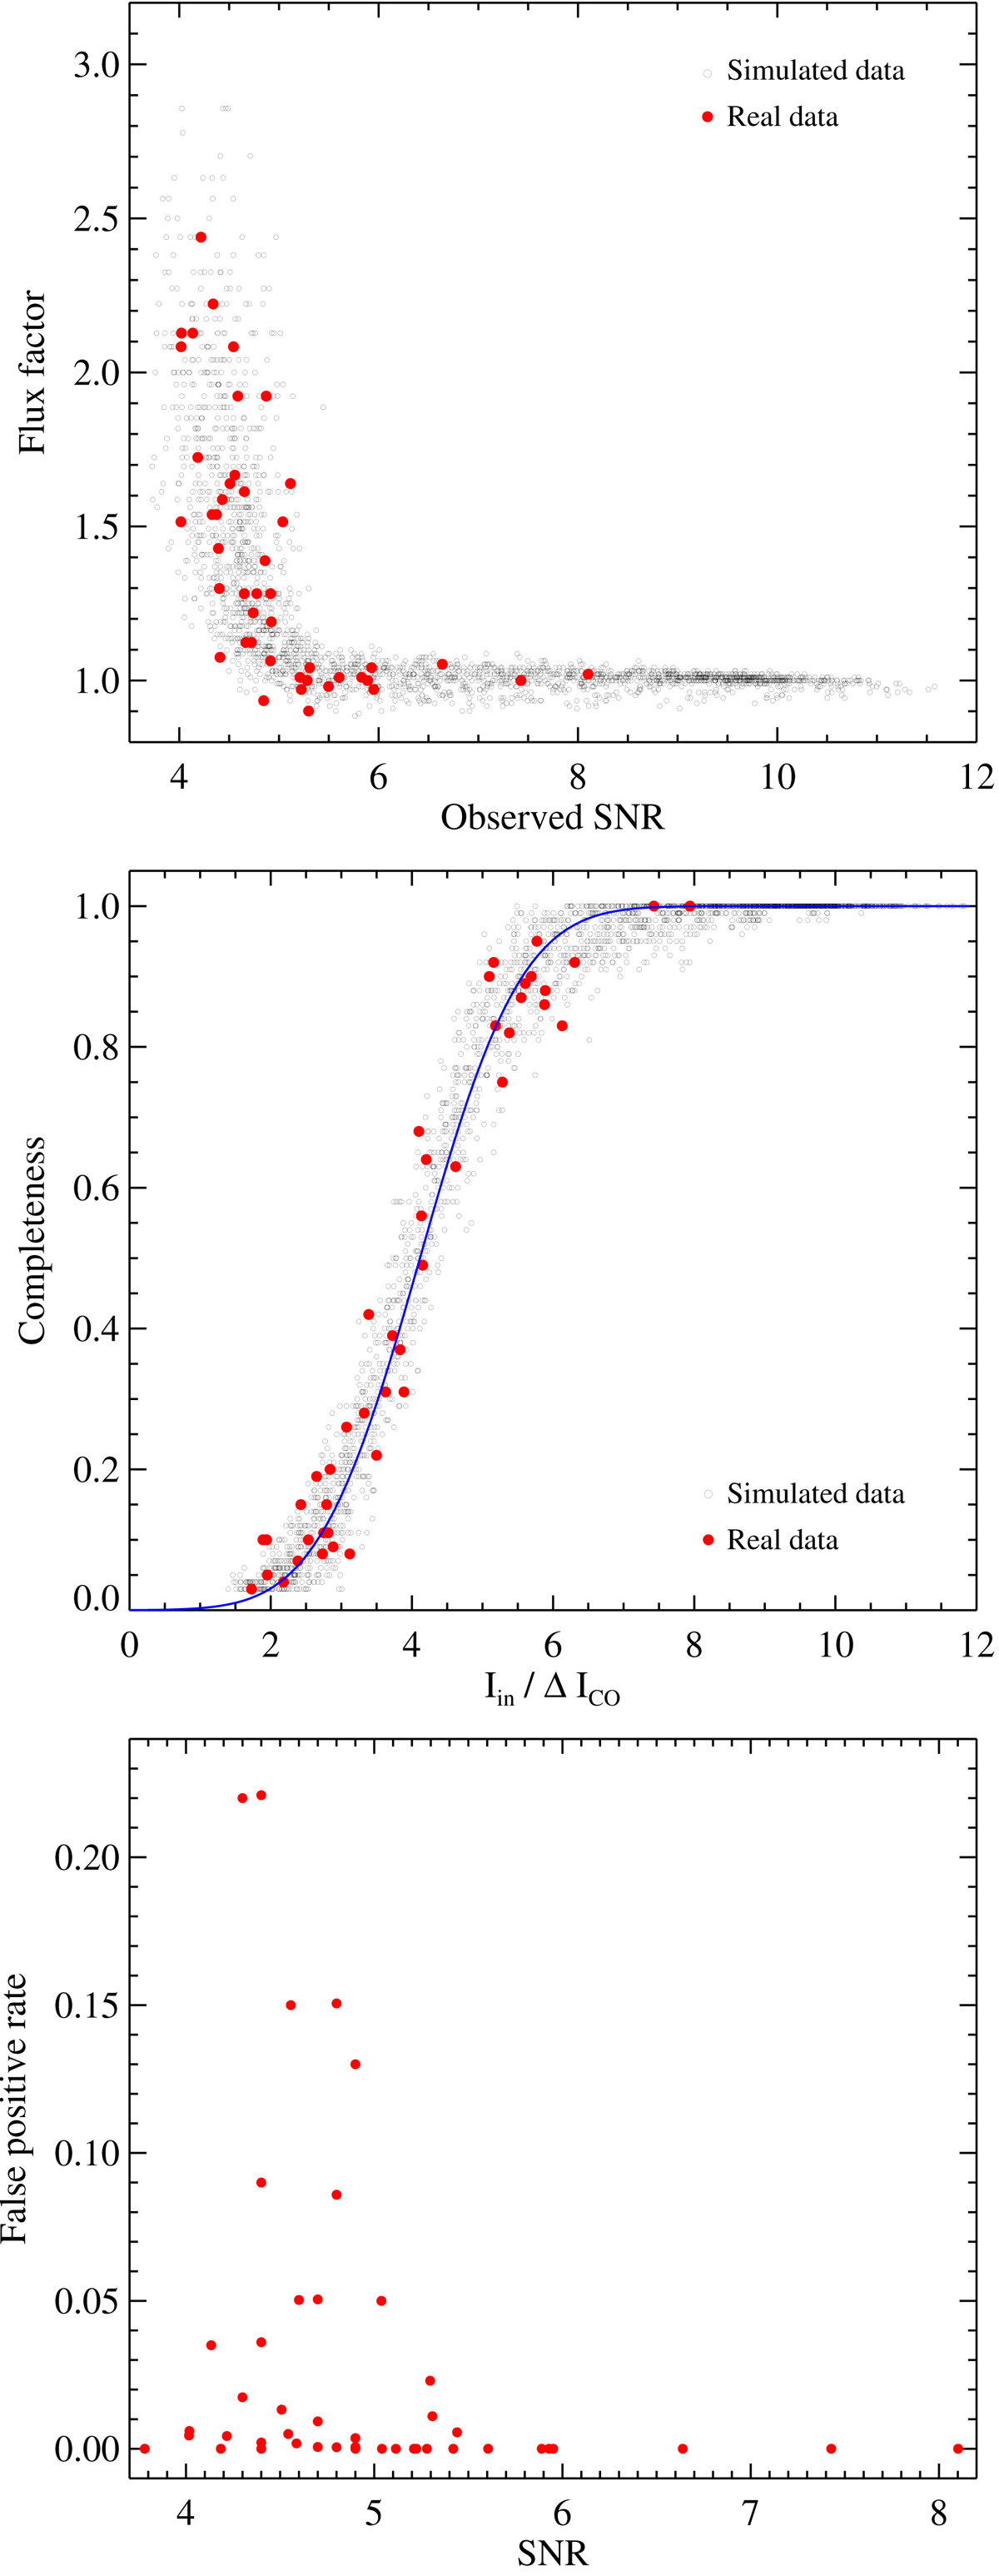
Top panel: flux boosting factor versus observed S/N for simulated data (open circle) and real detections (red filled circle). Central panel: completeness as a function of the injected line flux Iin over the measured flux uncertainty ΔICO. The Iin for real detections are line fluxes that have been corrected for flux boosting factors in the top panel. The blue curve shows the best fit to the simulated data (see Eq. (3)). The completeness decreases with decreasing integrated flux normalized by noise, indicating that sources are more difficult to detect at low S/N. This analysis allows us to correct CO luminosity functions for the completeness of our search algorithm. Bottom panel: false positive rate versus S/N for CO detections in this study.
Current usage metrics show cumulative count of Article Views (full-text article views including HTML views, PDF and ePub downloads, according to the available data) and Abstracts Views on Vision4Press platform.
Data correspond to usage on the plateform after 2015. The current usage metrics is available 48-96 hours after online publication and is updated daily on week days.
Initial download of the metrics may take a while.