Fig. 9.
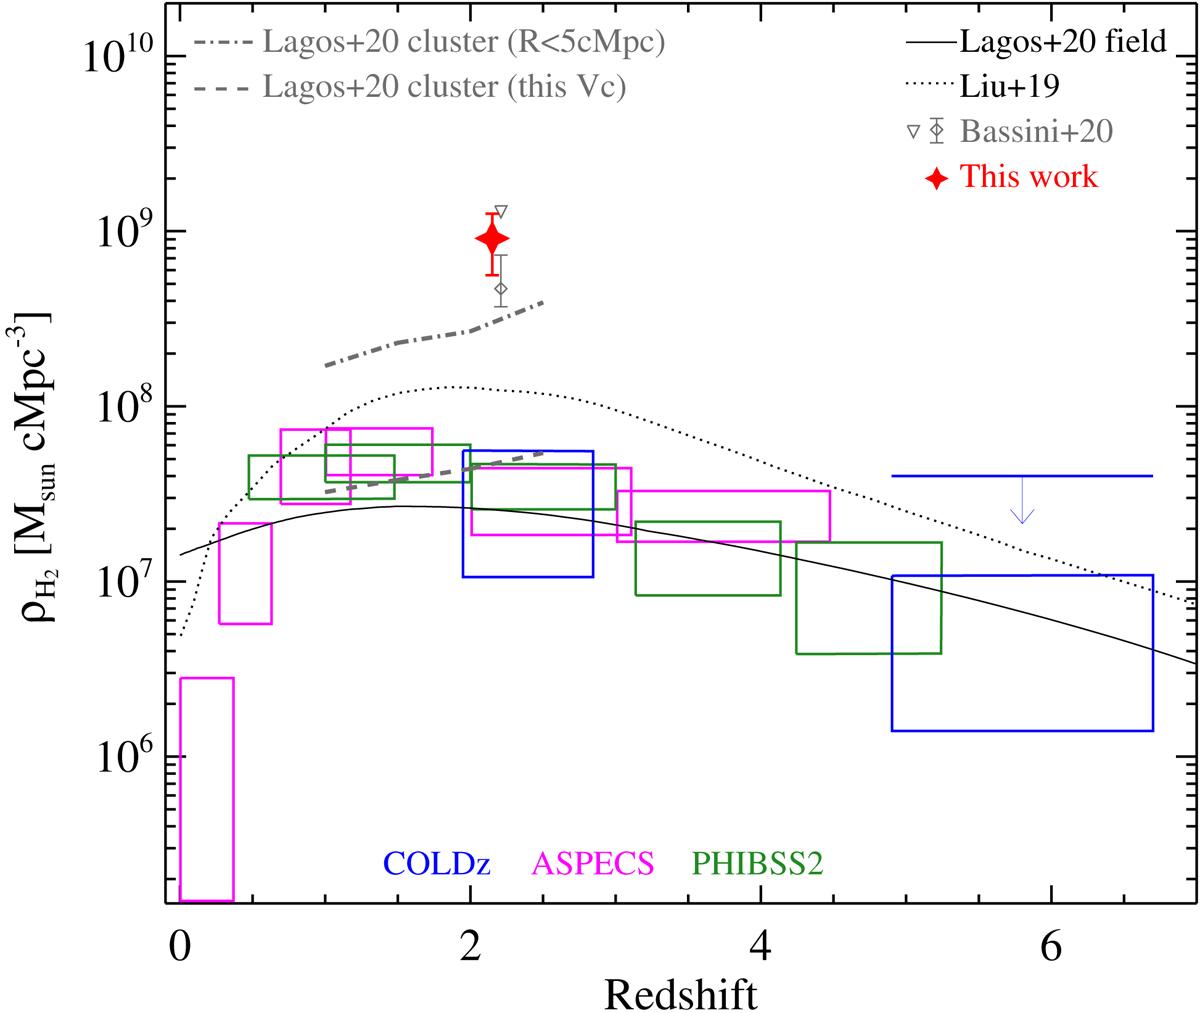
H2 density of this study (the red star) compared to results from COLDz (Riechers et al. 2019), ASPECS (Decarli et al. 2020), and PHIBSS2 (Lenkić et al. 2020) overlaid by the fitting of field galaxy samples from Liu et al. (2019) and Lagos et al. (2020). Gas density in galaxy clusters from simulations are shown via gray curves for SHARK (Lagos et al. 2020) in two volumes, and a gray diamond with a bar for DIANOGA (Bassini et al. 2020), respectively. The gray diamond with the error bar shows the median, and the downward triangle marks the maximum values for cluster structures in DIANOGA simulations. The gas density in this work is significantly higher than observed in blank fields and also higher than predictions for clusters in simulations.
Current usage metrics show cumulative count of Article Views (full-text article views including HTML views, PDF and ePub downloads, according to the available data) and Abstracts Views on Vision4Press platform.
Data correspond to usage on the plateform after 2015. The current usage metrics is available 48-96 hours after online publication and is updated daily on week days.
Initial download of the metrics may take a while.