Fig. 1.
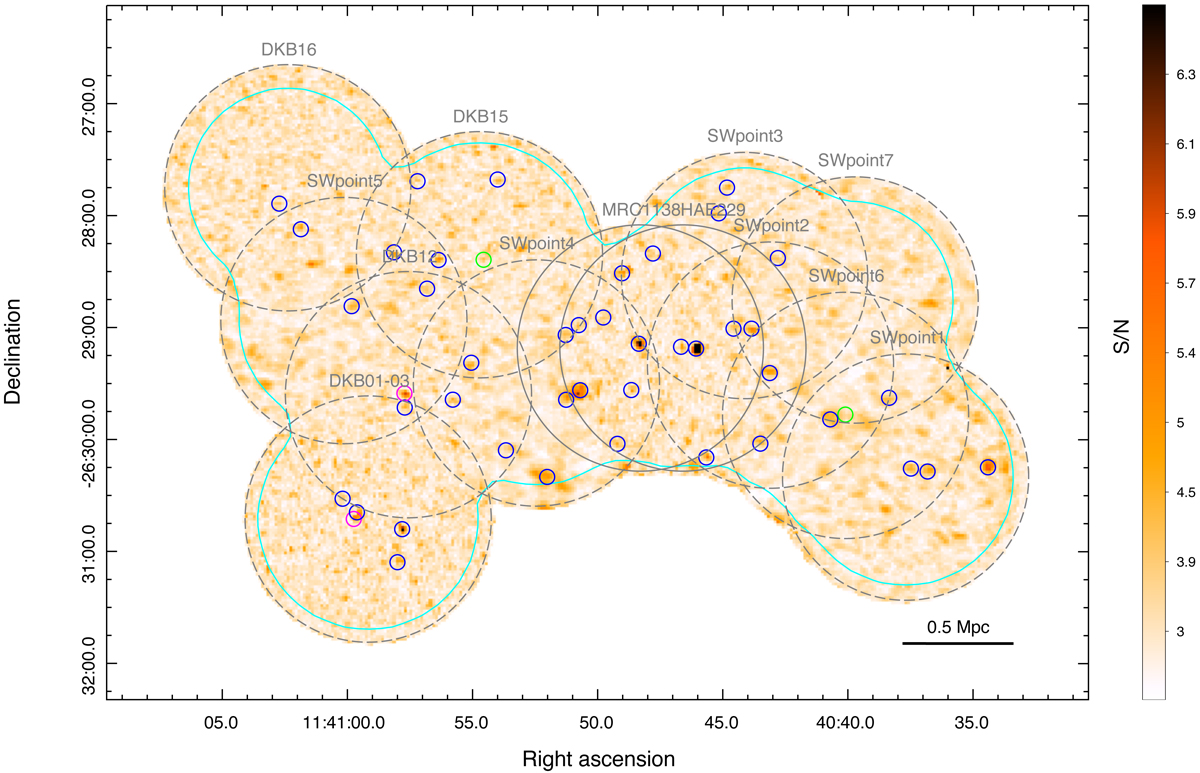
S/N map of line candidates (Sect. 3.1) in the ATCA mosaic. The S/N is the maximum S/N computed in the 1D spectrum on each pixel by our algorithm MaxFinder (see details in Sect. 3.1). The color bar values are limited in 1.5 < S/N < 6.5 for fair visibility of detections. ATCA pointings are shown in gray circles with a radius of 0.9′. Gray solid circles mark the pointings MRC1138 in Emonts et al. (2016) and HAE229 in Dannerbauer et al. (2017), respectively. The cyan contour encloses the area with rms < 1 mJy beam−1. Detected sources are marked by solid the following solid color circles: blue: category A; magenta: category B; green: category C (see details in Sect. 3.3).
Current usage metrics show cumulative count of Article Views (full-text article views including HTML views, PDF and ePub downloads, according to the available data) and Abstracts Views on Vision4Press platform.
Data correspond to usage on the plateform after 2015. The current usage metrics is available 48-96 hours after online publication and is updated daily on week days.
Initial download of the metrics may take a while.