Fig. 8
Download original image
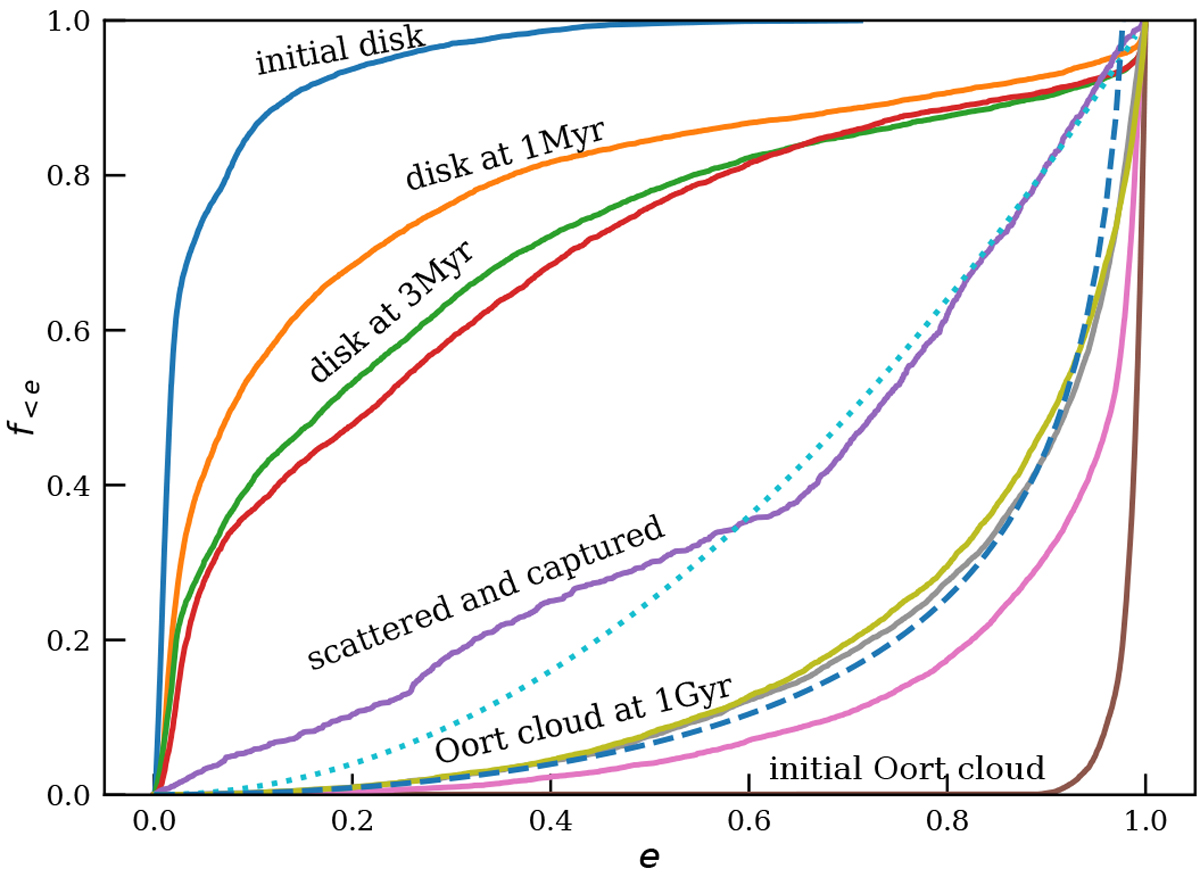
Cumulative distribution of the eccentricity at various stages of the evolution of the eventual Oort-cloud population of asteroids. The dotted and dashed curves are presented to guide the eye. The dotted curve gives the probability density function for the thermal distribution in eccentricity (f(e) ∝e2). The dashed curve gives an eccentricity probability density function ![]() , which matches the eventual Oort cloud distribution at 1 Gyr. The top four curves give the eccentricity distribution of the initial disk around the Sun (see Table 6), at the ages of 1 Myr, 3 Myr, and 10 Myr (red curve). The purple curve through the middle of the figure near the dotted curve gives the distribution of the two populations of scattered disk objects and the captured asteroids (see also Fig. 2 and Table 2). Both the scattered and captured populations are comparable in number. The bottom four curves give the distribution of the Oort cloud asteroids, from bottom to top immediately after the asteroids have entered the Oort cloud (indicated with “initial Oort cloud”), followed by the distribution at ages of 100 Myr, 500 Myr, and 1 Gyr (as indicated, see also Table 4). This figure contains data from simulations for which the parameters are listed in Table 6 (top curves), 2 (middle purple curve), and 4 (bottom set of curves).
, which matches the eventual Oort cloud distribution at 1 Gyr. The top four curves give the eccentricity distribution of the initial disk around the Sun (see Table 6), at the ages of 1 Myr, 3 Myr, and 10 Myr (red curve). The purple curve through the middle of the figure near the dotted curve gives the distribution of the two populations of scattered disk objects and the captured asteroids (see also Fig. 2 and Table 2). Both the scattered and captured populations are comparable in number. The bottom four curves give the distribution of the Oort cloud asteroids, from bottom to top immediately after the asteroids have entered the Oort cloud (indicated with “initial Oort cloud”), followed by the distribution at ages of 100 Myr, 500 Myr, and 1 Gyr (as indicated, see also Table 4). This figure contains data from simulations for which the parameters are listed in Table 6 (top curves), 2 (middle purple curve), and 4 (bottom set of curves).
Current usage metrics show cumulative count of Article Views (full-text article views including HTML views, PDF and ePub downloads, according to the available data) and Abstracts Views on Vision4Press platform.
Data correspond to usage on the plateform after 2015. The current usage metrics is available 48-96 hours after online publication and is updated daily on week days.
Initial download of the metrics may take a while.