Fig. 6
Download original image
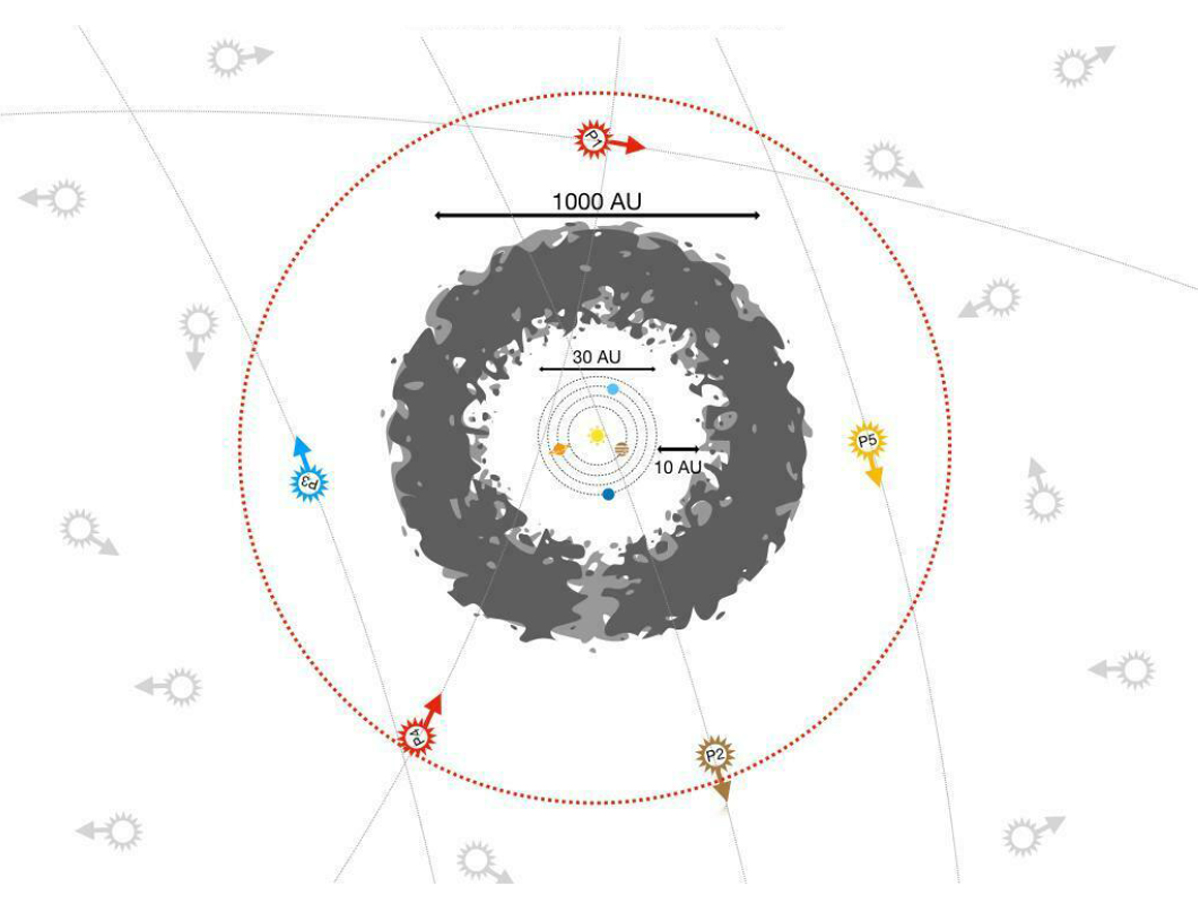
Illustration of the extended Solar System model (not to scale). The gray shaded region represents the debris disk with an outer radius of 1000 au. The dotted red circle indicates the boundary of the neighboring sphere, beyond which we ignore the influence of perturbations by passing stars. Gray symbols represent the stars in the cluster that are ignored. The colored star symbols (P1, P2, P3, P4, and P5) represent the five nearest stars that perturb the Solar System at a given time. The arrows indicate the direction of motion of the perturbers (figure from Torres et al. 2020a).
Current usage metrics show cumulative count of Article Views (full-text article views including HTML views, PDF and ePub downloads, according to the available data) and Abstracts Views on Vision4Press platform.
Data correspond to usage on the plateform after 2015. The current usage metrics is available 48-96 hours after online publication and is updated daily on week days.
Initial download of the metrics may take a while.