Fig. 3
Download original image
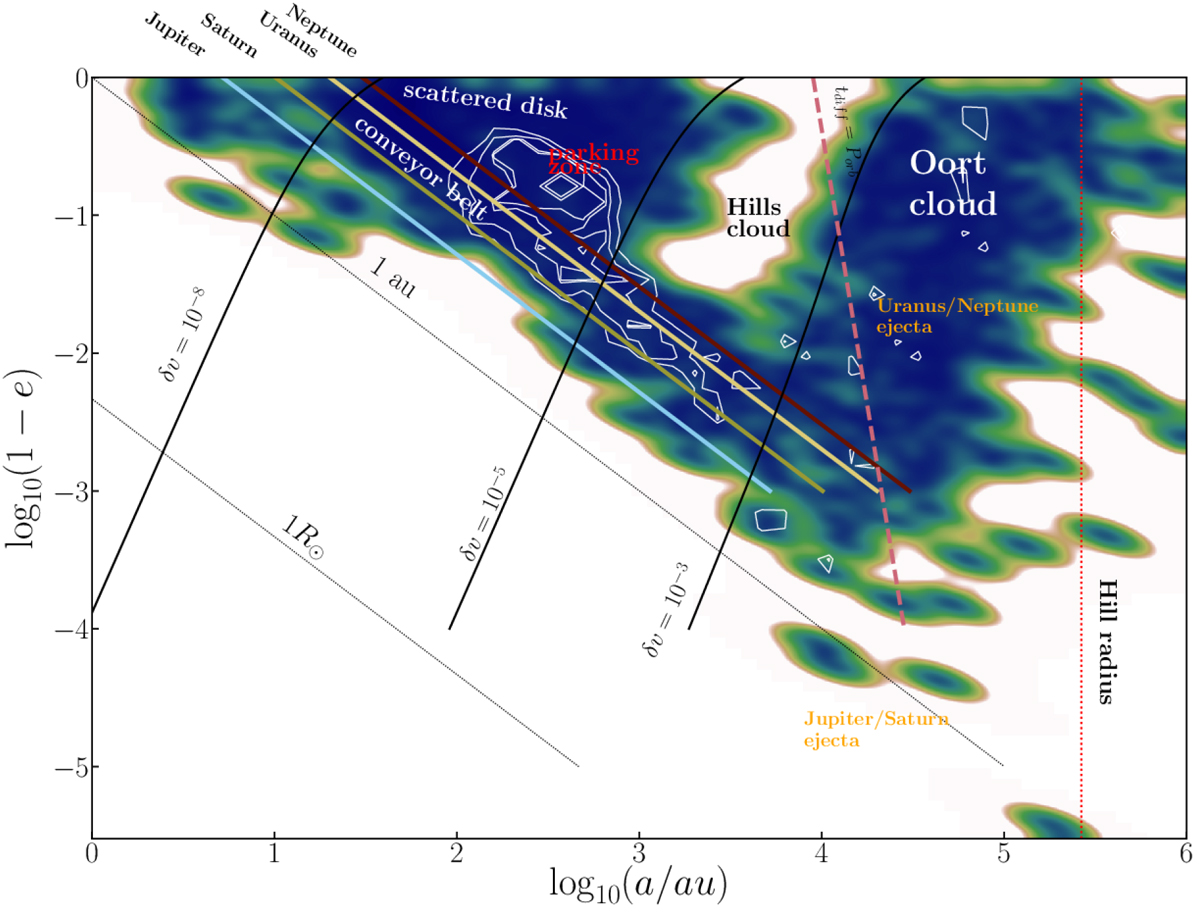
Phase-space distribution of asteroids around the Sun ~100 Myr after escape from its parent cluster. The shaded region presents a kernel-density estimation of the simulation results, representing various families of objects. We adopted a non-parametric Gaussian kernel density estimator with a symmetric bandwidth of 0.02 (Scott 1992). At this moment, part of the Oort cloud is already in place (to the right), but the formation process is still ongoing. The colored diagonal curves (from top left to bottom right) indicate orbits that cross those of the giant planets (see also Fig. 1). The dashed burgundy colored curve to the right indicates where the orbital period, Porb, is equal to the eccentricity damping-diffusion timescale by the Galactic tidal field (tdiff, Eq. (5) of Duncan et al. 1987). The solid black curves indicate the Galaxy’s perturbing influence in terms of the velocity-kick imparted to an object. Relative velocity perturbations of δv = 10−3 (right), 10−5, and 10−8 (left) are indicated. The little area to the right of Neptune’s influence (between the red diagonal curve and the black curve indicating a perturbation δv = 10−8) corresponds to the Kuiper-belt kernel distribution. The parking zone is indicated in red. The Oort cloud is to the right of the rightmost solid black curve (labeled as δv = 10−3) and the burgundy colored dashed curve. The Hills cloud is to the left of this dividing line (indicated in black). In our simulations, the Hills cloud at low eccentricity (e ≲ 0.95) is mostly empty, but at higher eccentricity (near the bottom of the figure) its population is substantial, in particular along the conveyor belt. The captured and scattered asteroids are indicated in white contours. Locally, at the extreme, both populations have comparable phase-space density. At the age of 100 Myr, a considerable fraction of the native disk population has already reached the Oort cloud, or is on its way there through the conveyor belt. Some captured asteroids are currently migrating along the conveyor belt and a few have already reached the Oort cloud. However, the majority of the scattered and captured asteroids are in the parking zone between ~ 100 au and ~ 1000 au, where they will stay for the duration of the simulation. Jupiter and Saturn eject asteroids along the conveyor belt into escaping orbits (indicated in orange). Uranus and Neptune eject asteroids on a timescale considerably longer (≳ 100 Myr) than that for Jupiter and Saturn (≲10 Myr), allowing these asteroids to be circularized by the Galactic tidal field (also in orange). This is also visible in the lower kernel density along the Jupiter–Saturn conveyor belt in comparison with the Uranus–Neptune conveyor belt. Eventually, the latter asteroids become members of the Oort cloud. The red dotted curve indicates the Hill radius of the Sun in orbit around the Galactic center, here at about 0.65 pc. The thin dotted diagonal curves indicate pericenter distances of 1 au and 1 R⊙. Comets from the Oort cloud may enter the inner Solar System (to the far bottom right and below the 1 au curve).
Current usage metrics show cumulative count of Article Views (full-text article views including HTML views, PDF and ePub downloads, according to the available data) and Abstracts Views on Vision4Press platform.
Data correspond to usage on the plateform after 2015. The current usage metrics is available 48-96 hours after online publication and is updated daily on week days.
Initial download of the metrics may take a while.