Fig. 2
Download original image
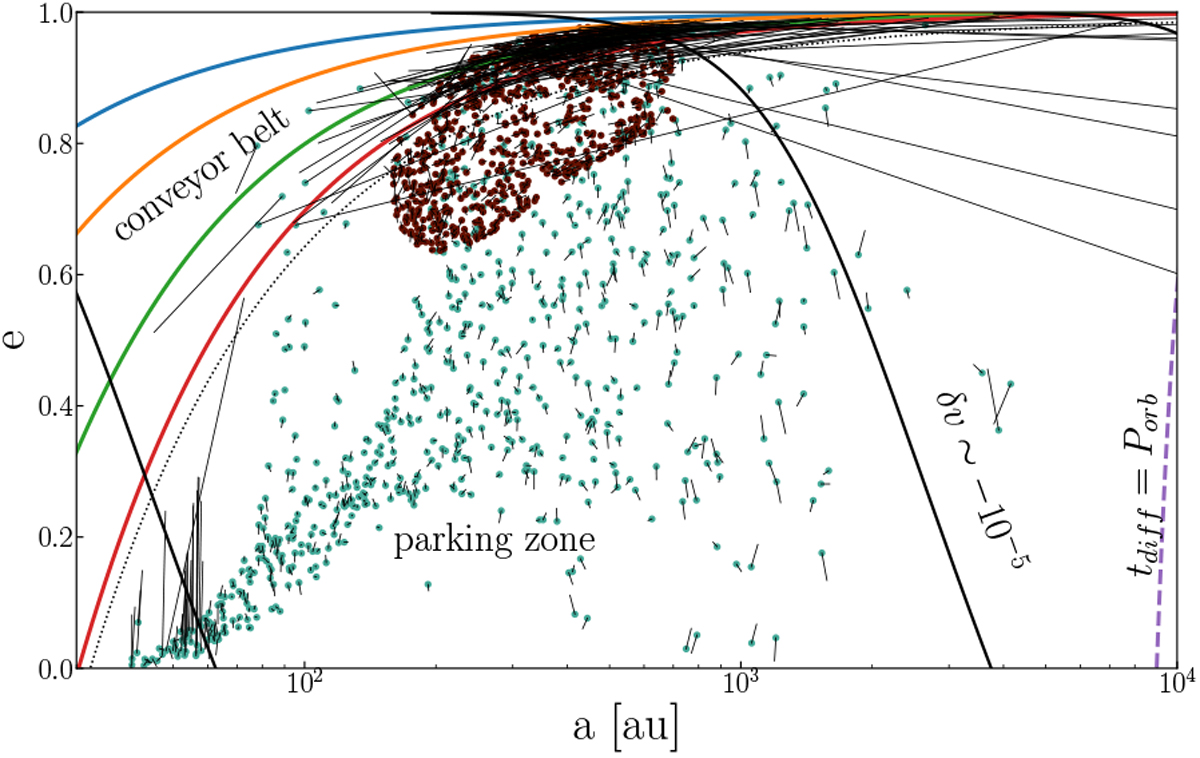
Orbital distribution of the scattered (green dots) and captured (brown) asteroids. These conditions originate from the scatter and capture calculations, but form the initial conditions for subsequent calculations. The former are scattered from the circumstellar debris disk by a close encounter with another star in the parent cluster. The latter population is captured from another star with which the Sun interacted in its parent cluster. The simulations for both populations are described inTable 2. The small thin black lines from each dot-point point in the direction in which the orbit migrates over 300 Myr (we adopted 300 Myr here for the presentation, although we realize that adopting 100 Myr would have been a more systematic choice). These data were acquired by integrating the Solar System in the tidal field of the Galaxy. The asteroids that orbit the outer and inner parking zones are hardly affected by the Galactic tidal field. Those near the conveyor belt are strongly affected by the giant planets and some eventually reach the Oort cloud. The thin black dotted curve is parallel to the 2.5 Hill-radii to the right of Neptune’s pericenter influence (solid red curve), and indicates the extent to which the planet still affects the orbits of the asteroid. Simulation parameters are listed in Table 2.
Current usage metrics show cumulative count of Article Views (full-text article views including HTML views, PDF and ePub downloads, according to the available data) and Abstracts Views on Vision4Press platform.
Data correspond to usage on the plateform after 2015. The current usage metrics is available 48-96 hours after online publication and is updated daily on week days.
Initial download of the metrics may take a while.