Fig. 1
Download original image
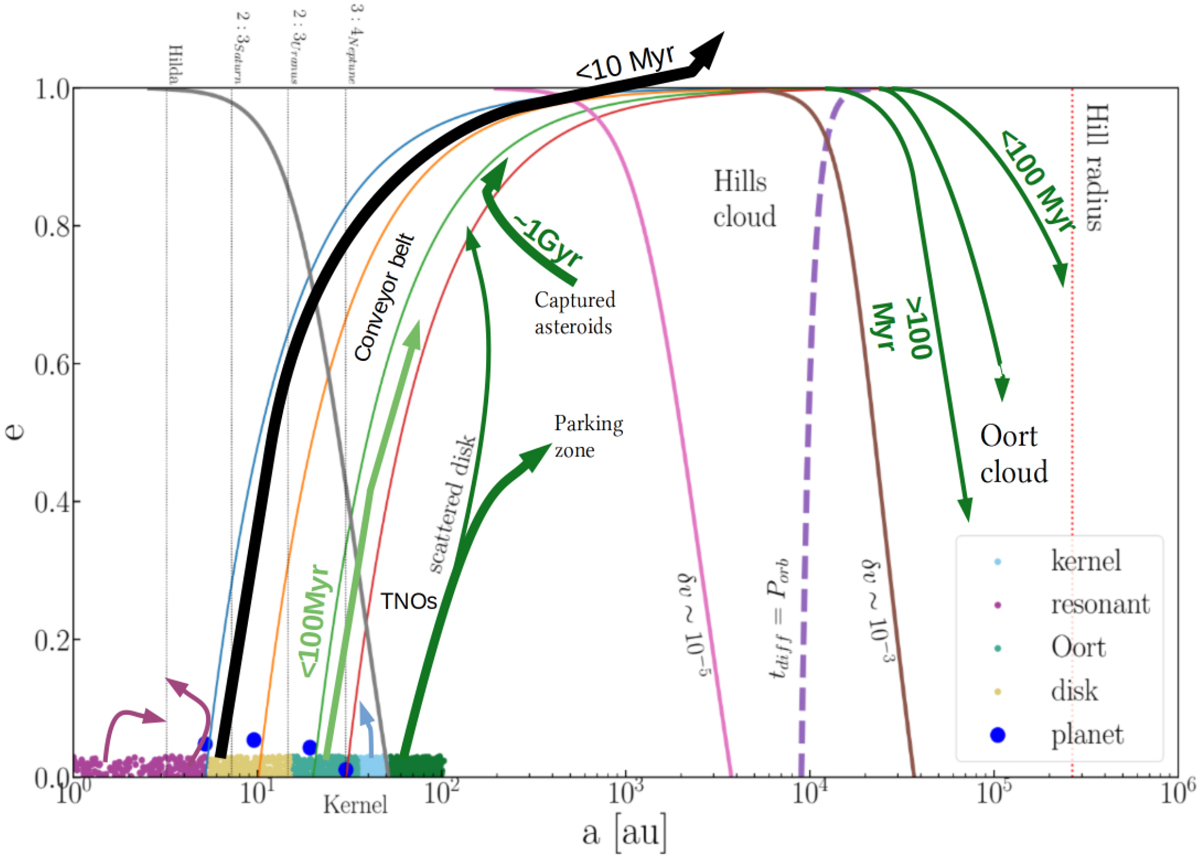
Orbital migration of asteroids and how they end-up in the Oort cloud. Several of the thin curves are also plotted in Fig. 3. The four major planets are indicated with their current semi-major axis and eccentricity as blue dots. The initial circumstellar disk is presented in five colors, depending on the final destination of the asteroids populating the different disk sections. The arrows indicate the movement of asteroids originating from the disk or captured from other stars. The timescales presented near the arrows give an estimate of the timescale of migration. The colors indicated in the legend give the original inner disk (magenta), which mainly migrates away from resonant orbits (Delbo’ et al. 2017) (four important resonances are indicated with thin vertical dotted lines). Ochre indicates those asteroids that are ejected from the Solar System on a relatively short timescale (≲ 10 Myr). Light blue indicates the kernel and the resonant Kuiper belt. The light green and dark green curves show the migration patterns of the asteroids that eventually reach the Oort cloud. These objects migrate from a semi-major axis of a few tens of au to beyond 104 au through a narrow neck of high eccentricity. The asteroids in the dark green area require external support from a stellar encounter to be able to migrate to the Oort cloud. This migration is more visible in Fig. 3, where the eccentricity (y-axis) is in logarithmic units. We note that the closer an asteroid is to the Hill radius (vertical red dotted line to the right), the quicker its orbit will be circularized by the Galactic tidal field (see also Fig. 7, where this is illustrated). The gray, pink, and brown curves indicate where the relative velocity kick imparted at apocenter by the Galactic tidal field to an asteroid is δv = 10−8, 10−5, and 10−3 of the orbital velocity, respectively. The purple dashed curve indicates the orbital separation and eccentricity for which the tidal eccentricity damping timescale is equal to the orbital period (see Duncan et al. 1987).
Current usage metrics show cumulative count of Article Views (full-text article views including HTML views, PDF and ePub downloads, according to the available data) and Abstracts Views on Vision4Press platform.
Data correspond to usage on the plateform after 2015. The current usage metrics is available 48-96 hours after online publication and is updated daily on week days.
Initial download of the metrics may take a while.