Free Access
Fig. 8.
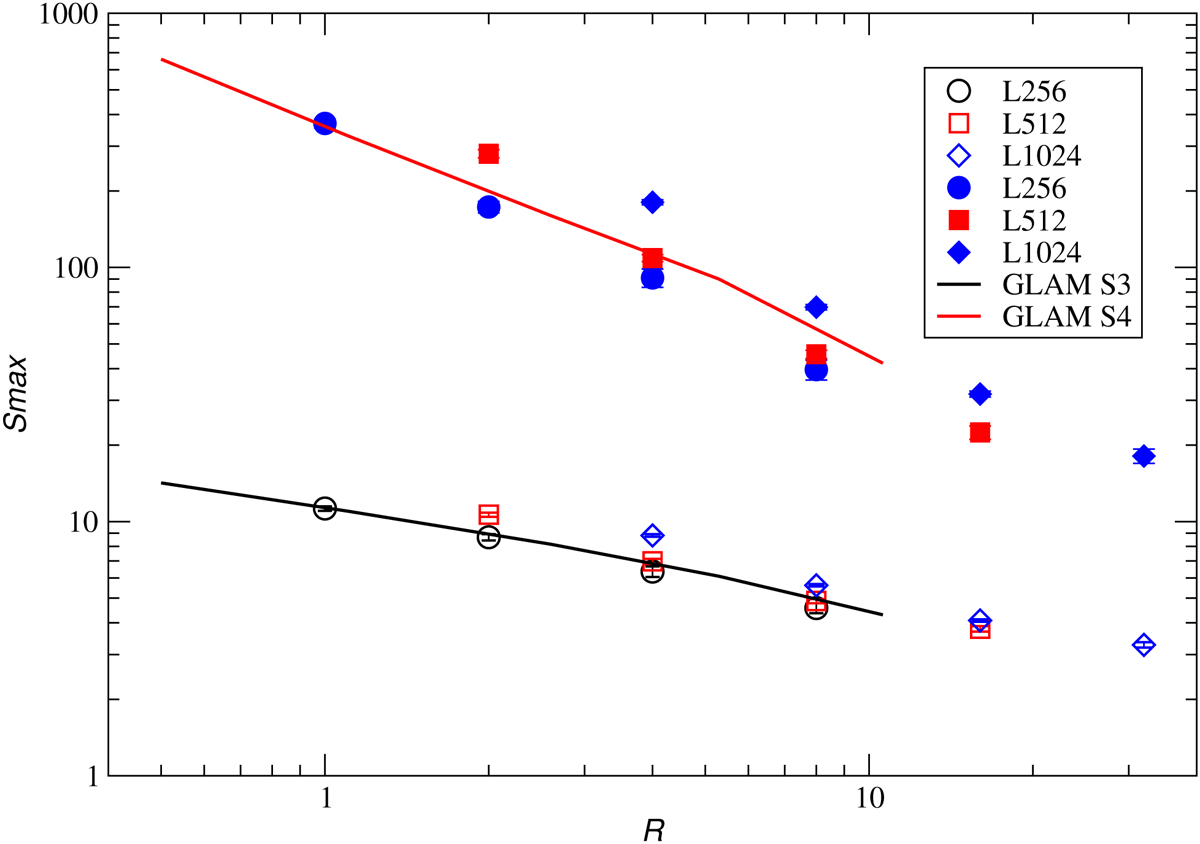
Maxima of the skewness S3 and kurtosis S4 evolutionary tracks as functions of the smoothing length Rt. Open symbols show the skewness S3 and filled symbols show the kurtosis S4 for GADGET simulations of various cube lengths L0. The black and red curves show the maxima of the S3 and S4 curves of the GLAM simulations.
Current usage metrics show cumulative count of Article Views (full-text article views including HTML views, PDF and ePub downloads, according to the available data) and Abstracts Views on Vision4Press platform.
Data correspond to usage on the plateform after 2015. The current usage metrics is available 48-96 hours after online publication and is updated daily on week days.
Initial download of the metrics may take a while.