Free Access
Fig. 7.
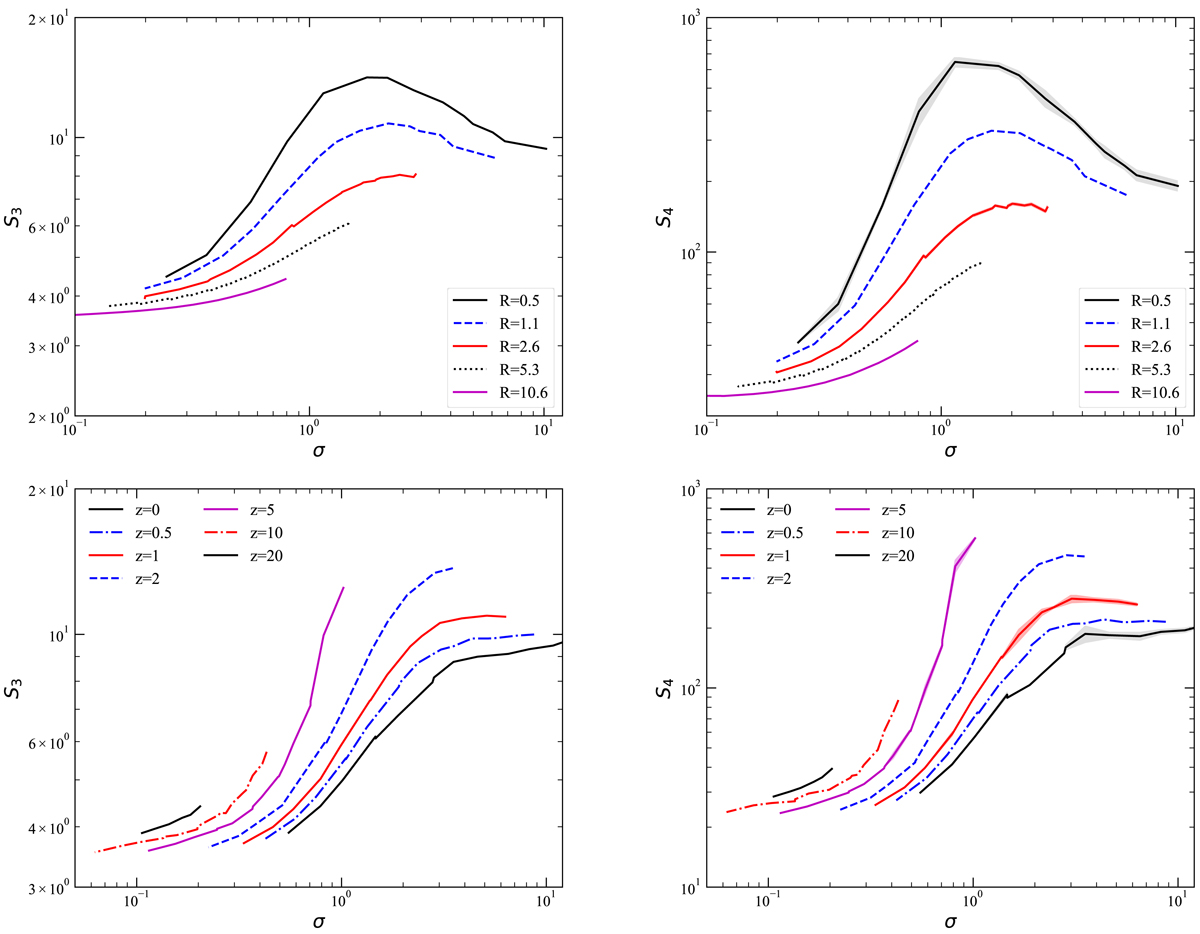
Top panels: evolutionary tracks. Bottom panels: evolutionary diagrams. Left panels: skewness S3. Right panels: kurtosis S4. The shaded areas correspond to the 1σ statistical uncertainties.
Current usage metrics show cumulative count of Article Views (full-text article views including HTML views, PDF and ePub downloads, according to the available data) and Abstracts Views on Vision4Press platform.
Data correspond to usage on the plateform after 2015. The current usage metrics is available 48-96 hours after online publication and is updated daily on week days.
Initial download of the metrics may take a while.