Fig. 6.
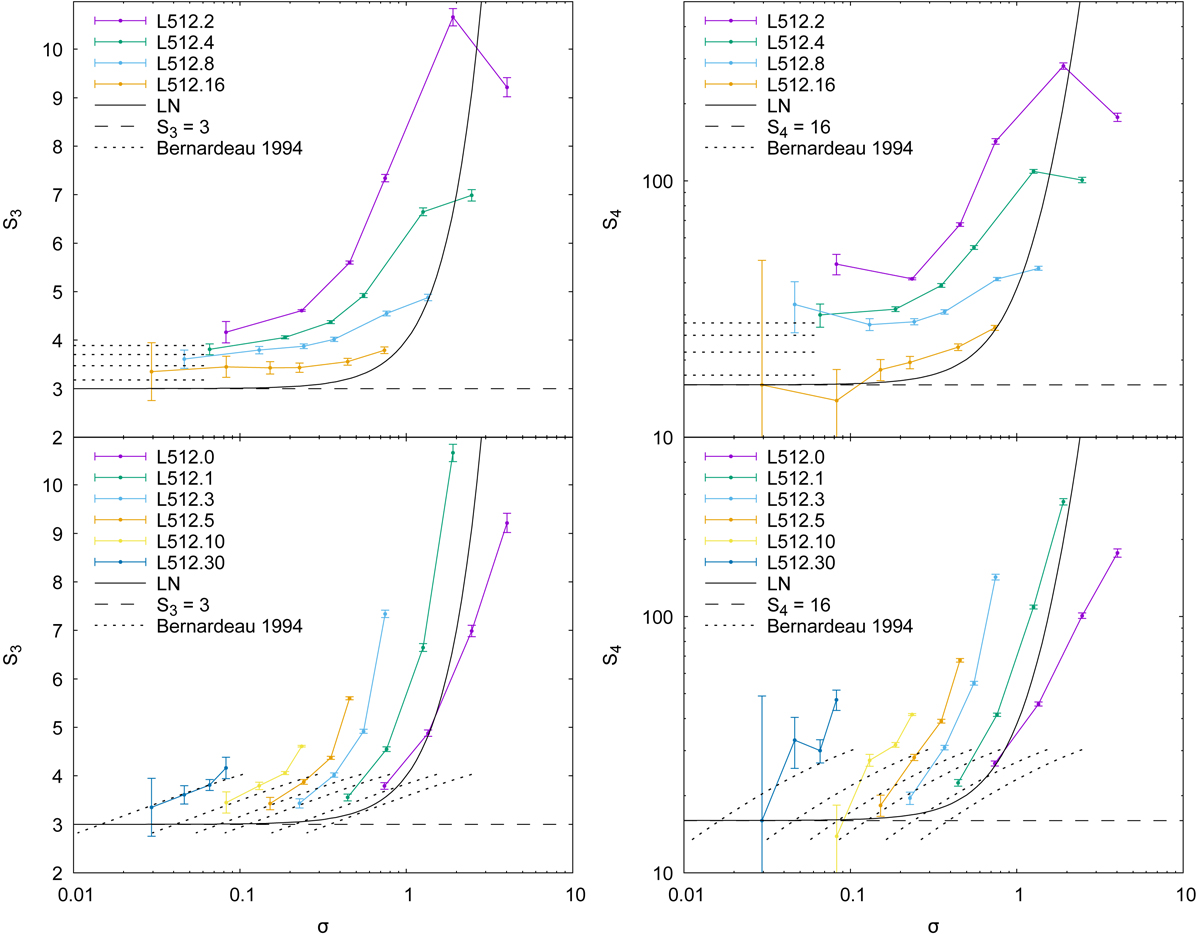
Top panels: evolutionary tracks. Bottom panels: evolutionary diagrams. Left panels: skewness S3. Right panels: kurtosis S4. In the evolutionary tracks, the symbols along the tracks from the left are for redshifts z = 30, 10, 5, 3, 1, and 0. In the evolutionary diagrams, the symbols from top to bottom correspond to smoothing lengths 2, 4, 8, and 16 h−1 Mpc. The solid black curves show the cosmological skewness S3 and kurtosis S4 according to the log-normal distribution. The dotted curves show the predictions of the perturbation theory Eq. (11).
Current usage metrics show cumulative count of Article Views (full-text article views including HTML views, PDF and ePub downloads, according to the available data) and Abstracts Views on Vision4Press platform.
Data correspond to usage on the plateform after 2015. The current usage metrics is available 48-96 hours after online publication and is updated daily on week days.
Initial download of the metrics may take a while.