Fig. 2.
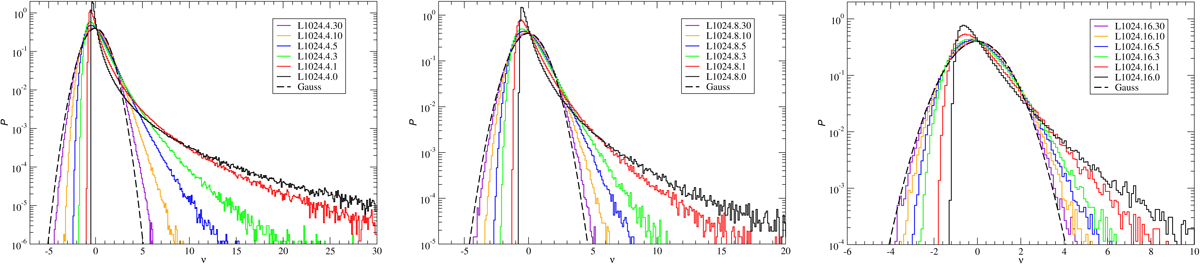
Density distribution functions P(δ) as functions of the DM density contrast δ normalised to the rms of density fluctuations ν = δ/σ for simulation L1024 smoothed with the cubic-cell method. Panels from left to right: smoothing lengths Rt = 4, 8, 16 h−1 Mpc, indicated as the first index in the simulation name and the redshift coded in the second index. Dashed curves show the Gaussian distribution.
Current usage metrics show cumulative count of Article Views (full-text article views including HTML views, PDF and ePub downloads, according to the available data) and Abstracts Views on Vision4Press platform.
Data correspond to usage on the plateform after 2015. The current usage metrics is available 48-96 hours after online publication and is updated daily on week days.
Initial download of the metrics may take a while.