Fig. B.1.
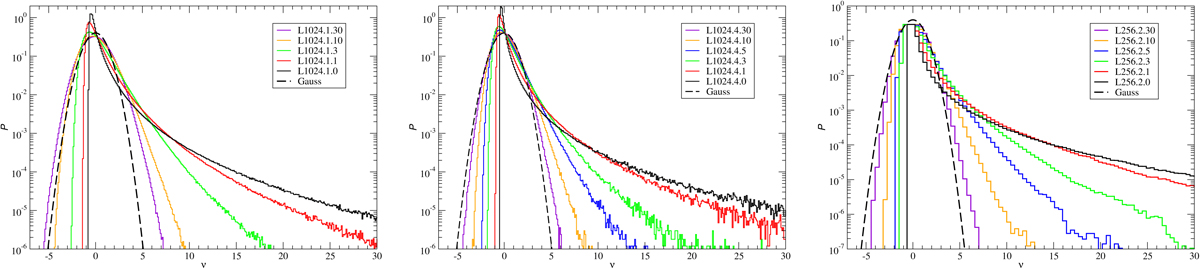
PDFs as functions of reduced densities ν = δ/σ, smoothed with different methods. Left and central panels show simulation L1024.1 smoothed with a B3 spline and the cubic-cell method, respectively, using a smoothing kernel length R = 4 h−1 Mpc. Right panel: Simulation L256.2 smoothed with the top-hat method with a kernel R = 2 h−1 Mpc. The smoothing rank is the first index in the simulation name, and the redshift is the second index. Colours indicate the evolutionary epoch z = 30, 10, 5, 3, 1, and 0. The dashed bold curves show the Gaussian distribution.
Current usage metrics show cumulative count of Article Views (full-text article views including HTML views, PDF and ePub downloads, according to the available data) and Abstracts Views on Vision4Press platform.
Data correspond to usage on the plateform after 2015. The current usage metrics is available 48-96 hours after online publication and is updated daily on week days.
Initial download of the metrics may take a while.