Fig. 1.
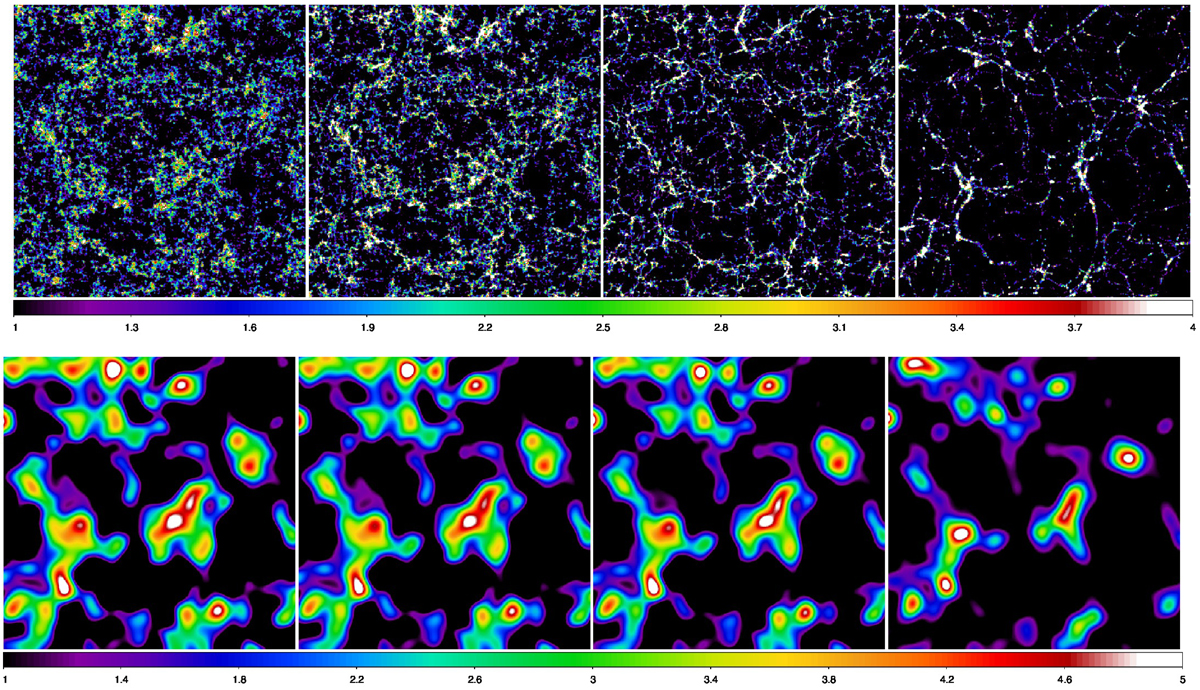
Density fields of simulation L256 without additional smoothing and with a smoothing length 8 h−1 Mpc are shown in the upper and bottom panels, respectively. The panels from left to right show fields for epochs z = 30, z = 10, z = 3, and z = 0, presented in slices of size 200 × 200 × 0.5 h−1 Mpc. Only over-density regions are shown with colour scales from left to right 1−1.4, 1−2, 1−4, and 1−8 in the upper panels and 1−1.08, 1−1.25, 1−1.8, and 1−5 in the lower panels.
Current usage metrics show cumulative count of Article Views (full-text article views including HTML views, PDF and ePub downloads, according to the available data) and Abstracts Views on Vision4Press platform.
Data correspond to usage on the plateform after 2015. The current usage metrics is available 48-96 hours after online publication and is updated daily on week days.
Initial download of the metrics may take a while.