Open Access
Fig. 5.
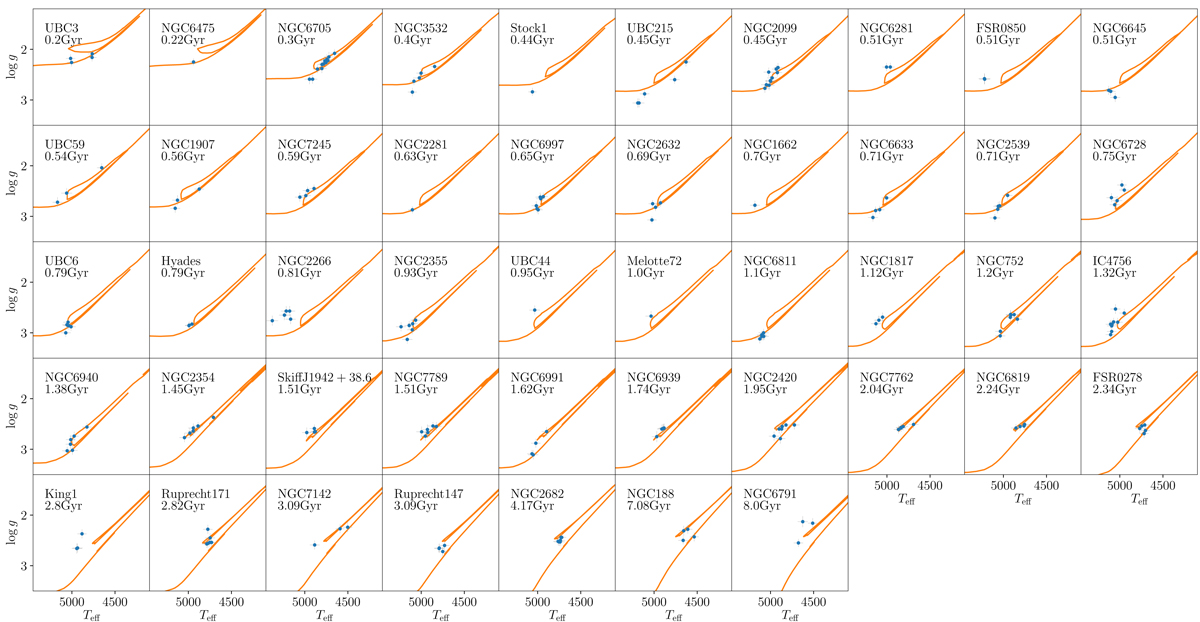
Teff–log g diagrams resulting from the analysis of the analyzed RC stars in blue. The clusters are sorted according to age. The same isochrones of Fig. 4 are overplotted with the corresponding [M/H] and age.
Current usage metrics show cumulative count of Article Views (full-text article views including HTML views, PDF and ePub downloads, according to the available data) and Abstracts Views on Vision4Press platform.
Data correspond to usage on the plateform after 2015. The current usage metrics is available 48-96 hours after online publication and is updated daily on week days.
Initial download of the metrics may take a while.