Open Access
Fig. 3.
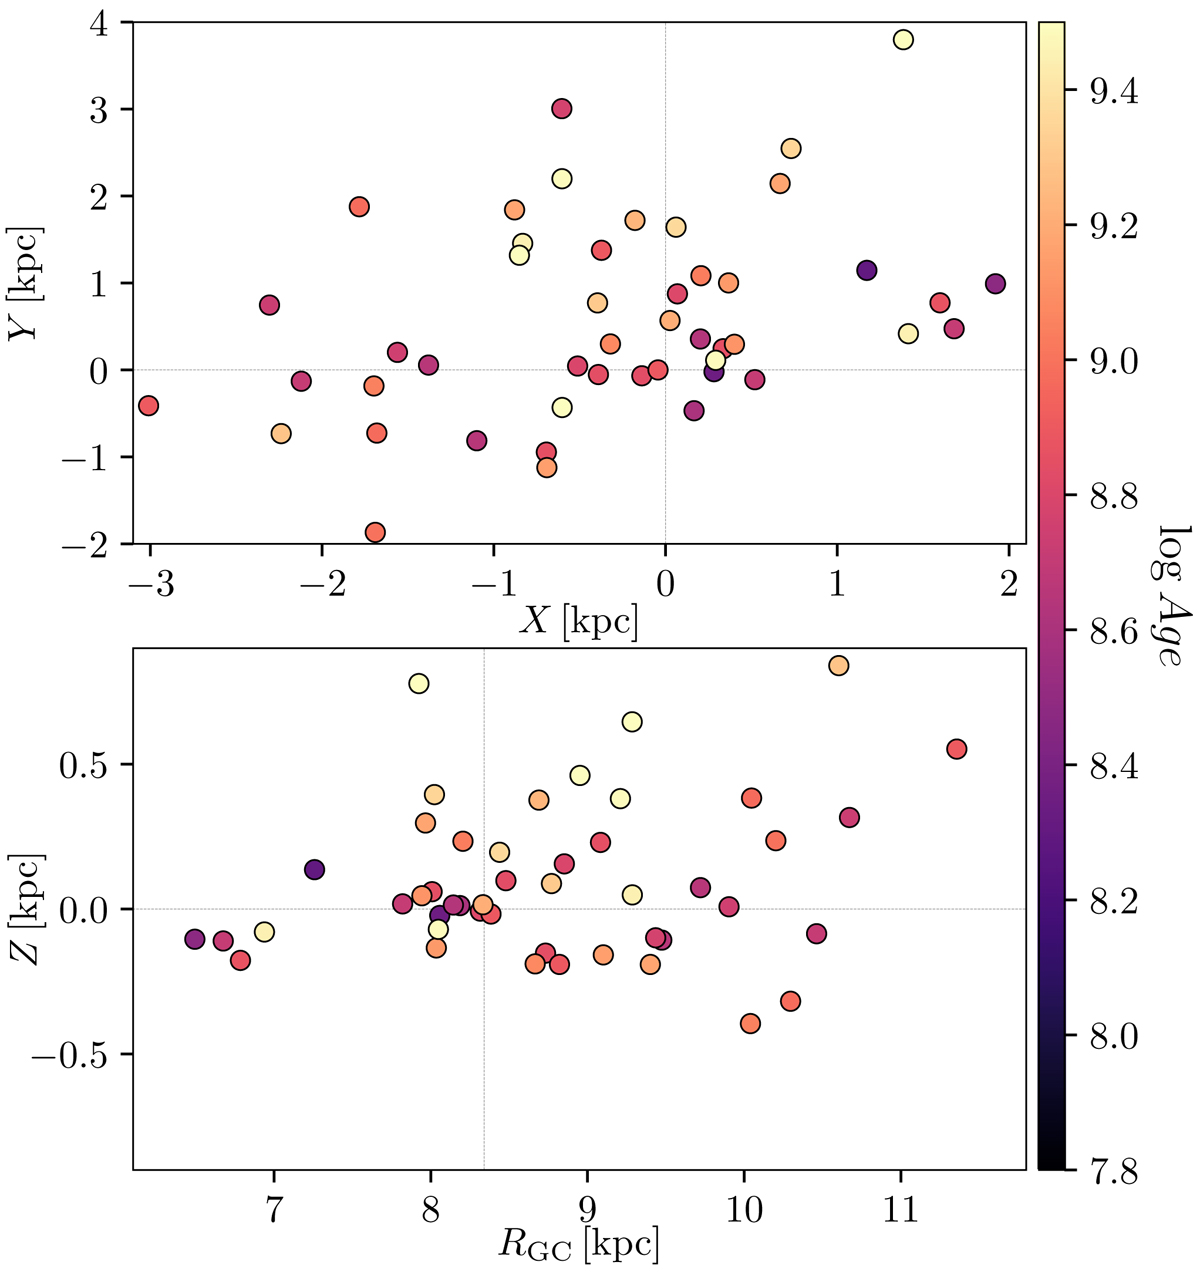
Top: X,Y distribution of the sample of OCs used in this work, where the Galactic center is towards the right. Bottom: Z, RGC distribution of the sample of clusters. The color represents the age of the cluster. The dashed lines indicate the position of the Sun (X⊙, Y⊙, Z⊙) = (0, 0, 0), RGC = 8.34 kpc.
Current usage metrics show cumulative count of Article Views (full-text article views including HTML views, PDF and ePub downloads, according to the available data) and Abstracts Views on Vision4Press platform.
Data correspond to usage on the plateform after 2015. The current usage metrics is available 48-96 hours after online publication and is updated daily on week days.
Initial download of the metrics may take a while.