Open Access
Fig. 13.
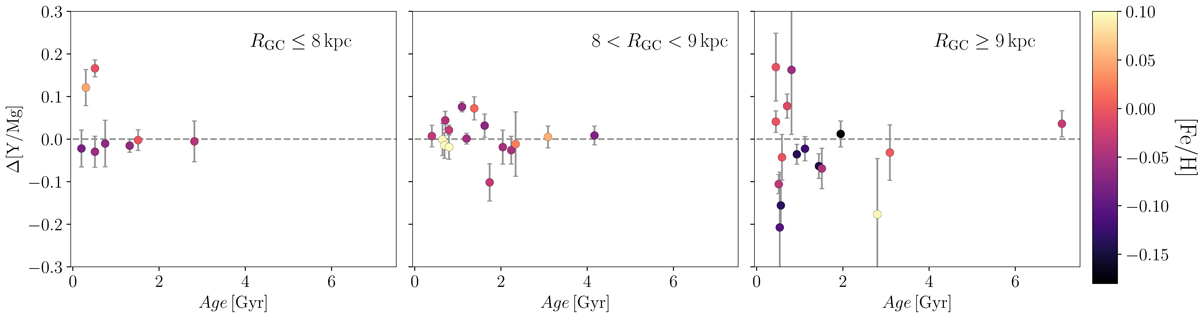
Residuals in the [Y/Mg] (with respect to the linear fit for the closest sample Eq. (1)) versus age in three bins of Galactocentric radius, indicated in each panel. The color code is the derived [Fe/H] abundance.
Current usage metrics show cumulative count of Article Views (full-text article views including HTML views, PDF and ePub downloads, according to the available data) and Abstracts Views on Vision4Press platform.
Data correspond to usage on the plateform after 2015. The current usage metrics is available 48-96 hours after online publication and is updated daily on week days.
Initial download of the metrics may take a while.