Fig. 8.
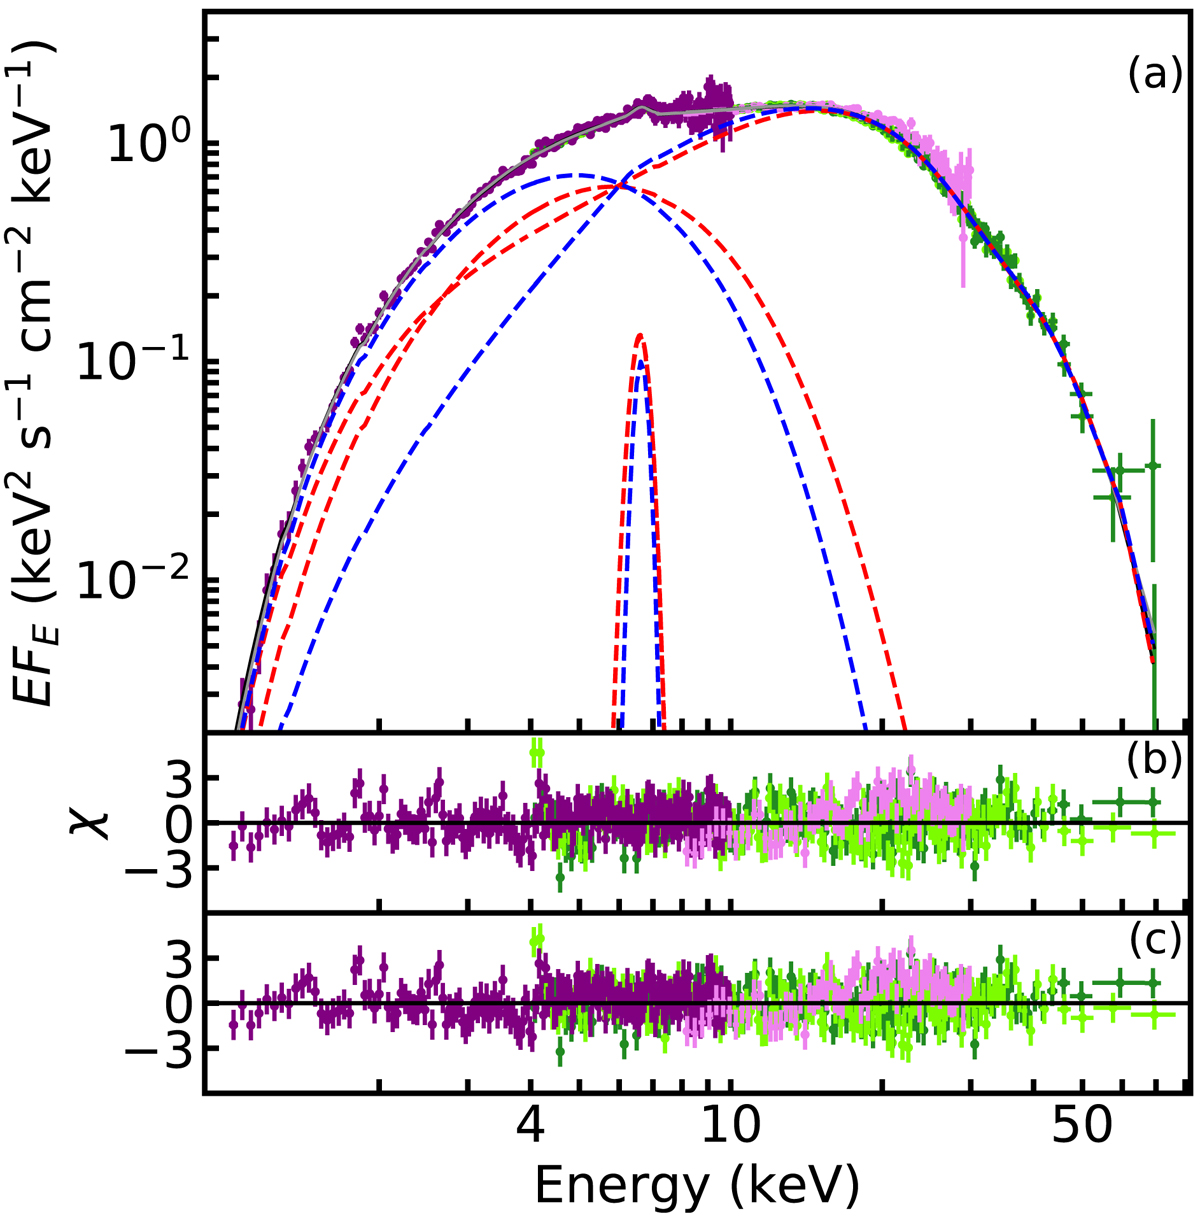
Panel a: X-ray spectrum of 4U 1901+03 collected during NuObs3 together with the two-component models TBABS × (GAU + COMPTT + COMPTT × GABS) and TBABS × (GAU + PO × HIGHECUT + PO × HIGHECUT × GABS) where the corresponding model components are shown by the dashed curves in red and blue, respectively. Panel b: residuals for the former composite model (COMPTT). Panel c: residuals for the latter composite model (PO×HIGHECUT). The color code is same as for Fig. 2.
Current usage metrics show cumulative count of Article Views (full-text article views including HTML views, PDF and ePub downloads, according to the available data) and Abstracts Views on Vision4Press platform.
Data correspond to usage on the plateform after 2015. The current usage metrics is available 48-96 hours after online publication and is updated daily on week days.
Initial download of the metrics may take a while.