Fig. 5.
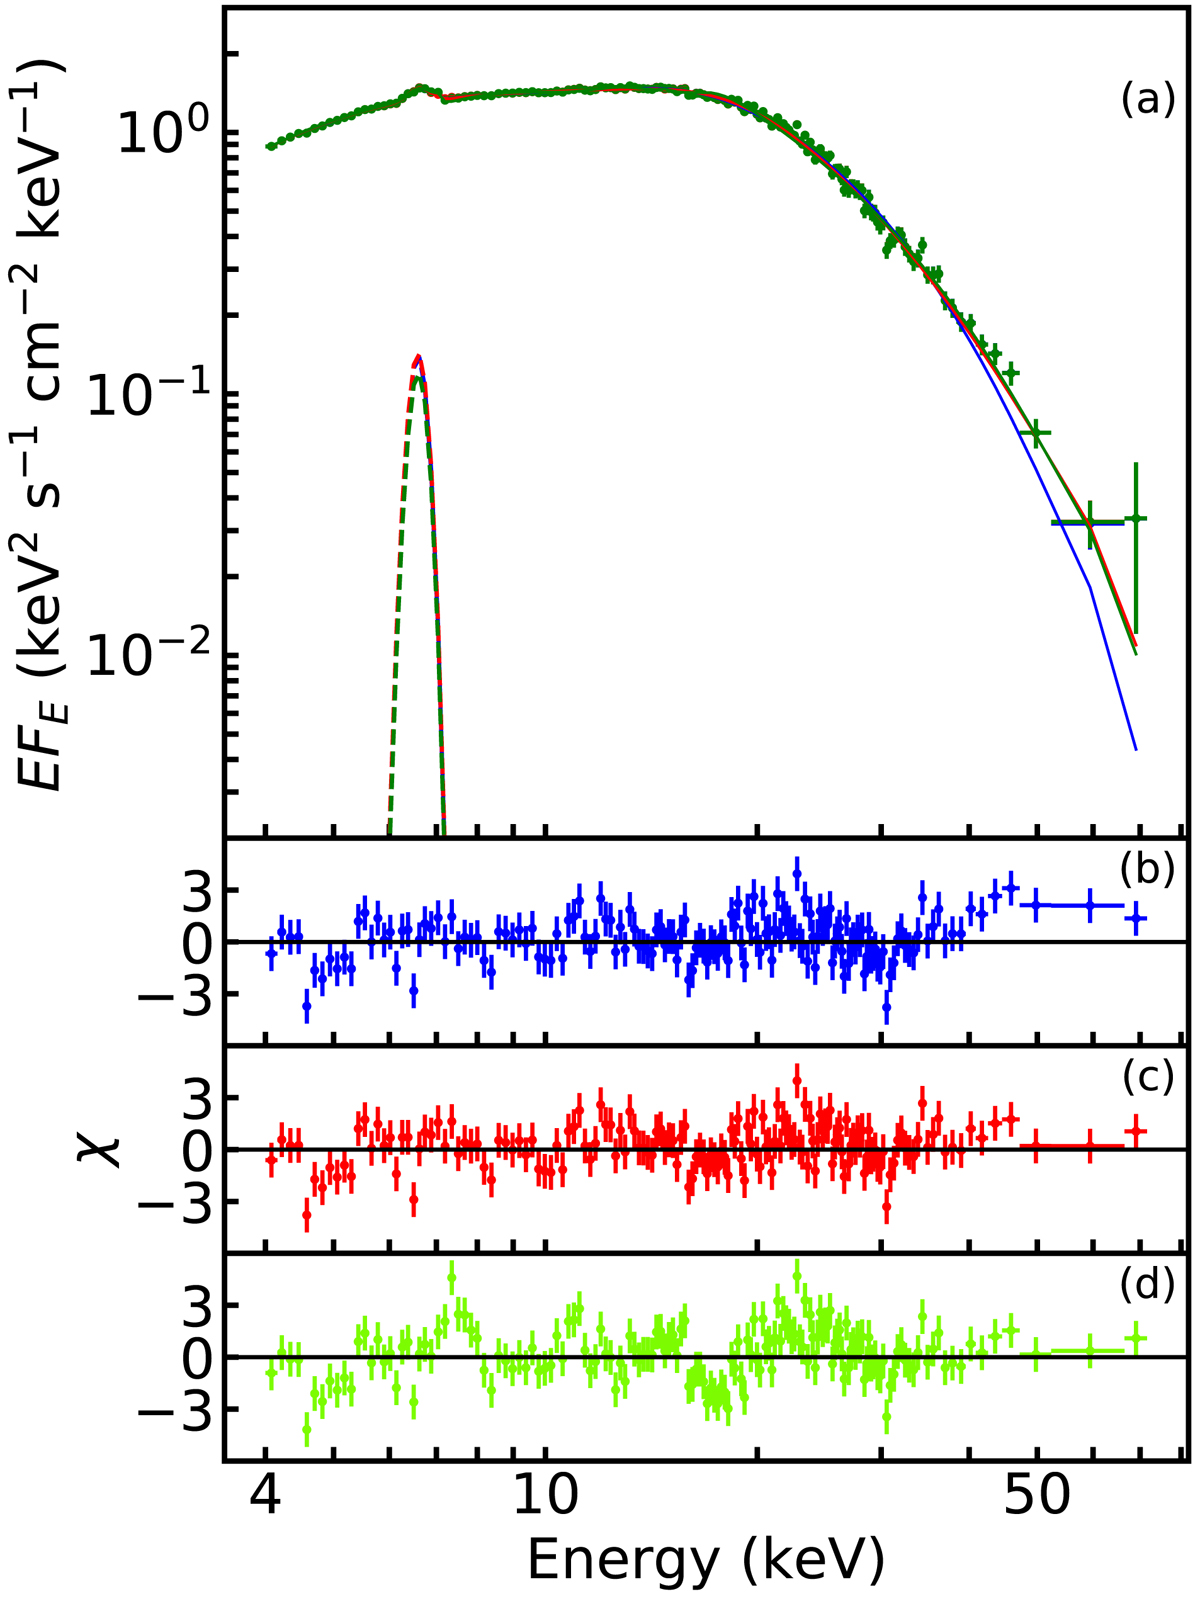
Panel a: X-ray spectrum of 4U 1901+03 taken from NuObs3 together with the composite model TBABS × (GAU + CONTINUUM × GABS) (solid lines) where CONTINUUM stands for CUTOFFPL, NPEX and PO × HIGHECUT and shown by blue, red and green curves, respectively. The corresponding residuals are shown in panels b, c and d. Only FPMA data are shown for the sake of clarity.
Current usage metrics show cumulative count of Article Views (full-text article views including HTML views, PDF and ePub downloads, according to the available data) and Abstracts Views on Vision4Press platform.
Data correspond to usage on the plateform after 2015. The current usage metrics is available 48-96 hours after online publication and is updated daily on week days.
Initial download of the metrics may take a while.