Fig. 3.
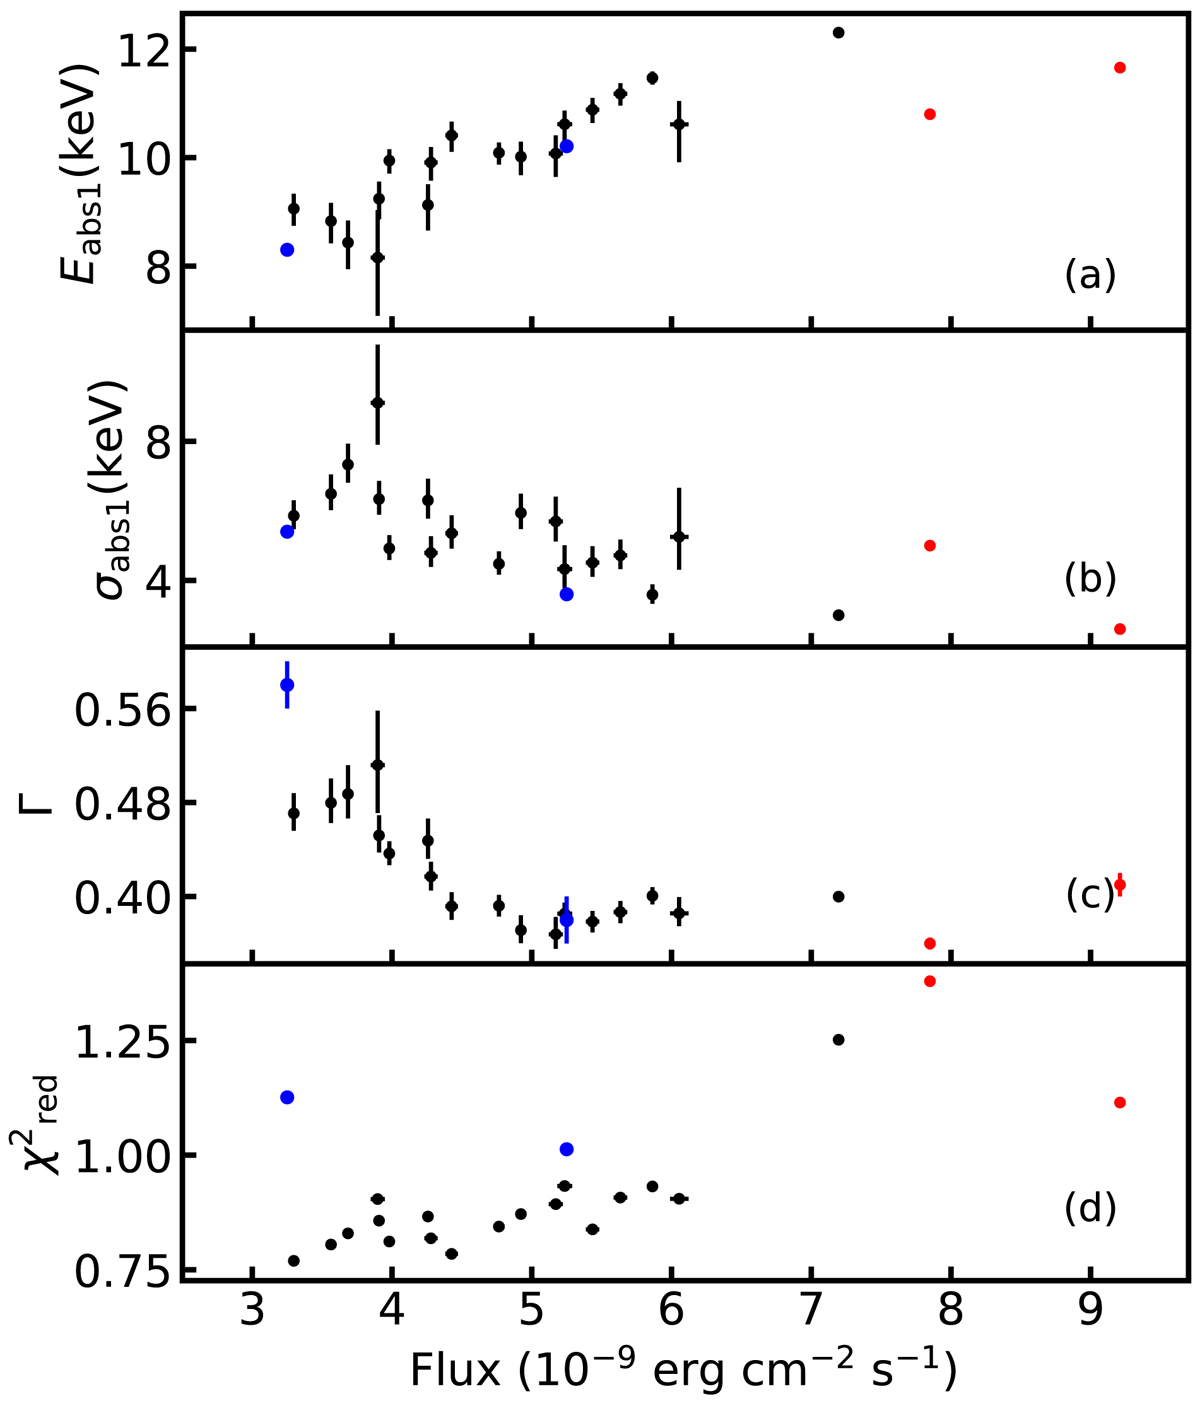
Evolution of the 10 keV absorption feature energy Eabs1(panel a), its width σabs1(panel b), the photon index Γ(panel c), and the reduced χ2 of the fits (panel d) as a function of the 1–30 keV flux obtained from the Insight-HXMT data (black points). Red and blue dots show the same parameters derived from two single NuSTAR observations and two combined observations (NuSTAR+Insight-HXMT), respectively. We used the model TBABS × (GAU+CUTOFFPL × GABS) here with the NH and Ecut fixed at 2.4 × 1022 cm−2 and 6.66 keV, respectively (see the text).
Current usage metrics show cumulative count of Article Views (full-text article views including HTML views, PDF and ePub downloads, according to the available data) and Abstracts Views on Vision4Press platform.
Data correspond to usage on the plateform after 2015. The current usage metrics is available 48-96 hours after online publication and is updated daily on week days.
Initial download of the metrics may take a while.