Fig. 2.
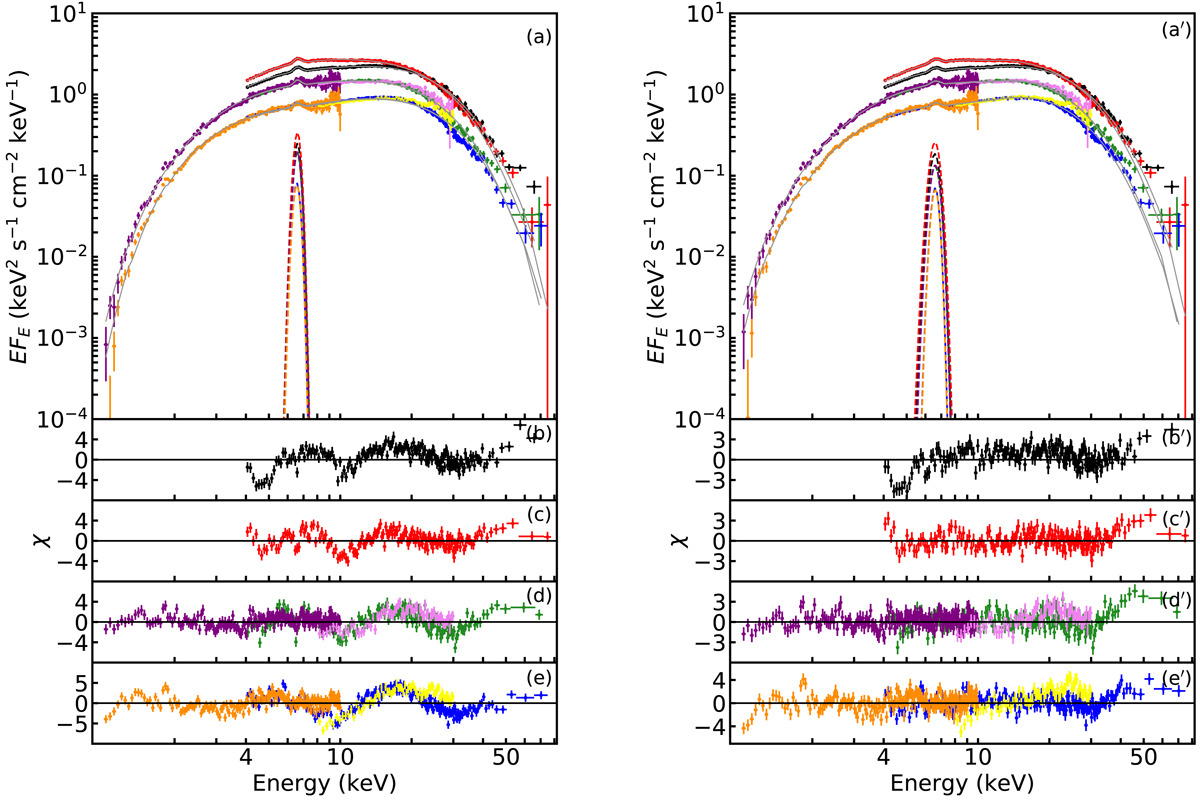
Left panels: X-ray spectra of 4U 1901+03 obtained by Insight-HXMT (LE and ME detectors in purple and pink for third data set and orange and yellow for fourth data set, respectively) and NuSTAR (from the first to the last chronologically in black, red, green, and blue, respectively. Only FPMA data are shown here for clarity). During the outburst together with the composite model TBABS × (COMPTT + GAUSSIAN) (solid grey curves) shown in panel a. The dashed curves with the same colours show the iron line component. Residuals for the four data sets using the corresponding composite model are shown in units of standard deviations (panels b–e). Right panels: same X-ray spectra as in panel a fitted with the same composite model but with a GABS component added to account for the absorption feature at 10 keV (panel a′). Residuals of the same spectra using the corresponding composite model are shown in panels b′–e′.
Current usage metrics show cumulative count of Article Views (full-text article views including HTML views, PDF and ePub downloads, according to the available data) and Abstracts Views on Vision4Press platform.
Data correspond to usage on the plateform after 2015. The current usage metrics is available 48-96 hours after online publication and is updated daily on week days.
Initial download of the metrics may take a while.