Fig. 10.
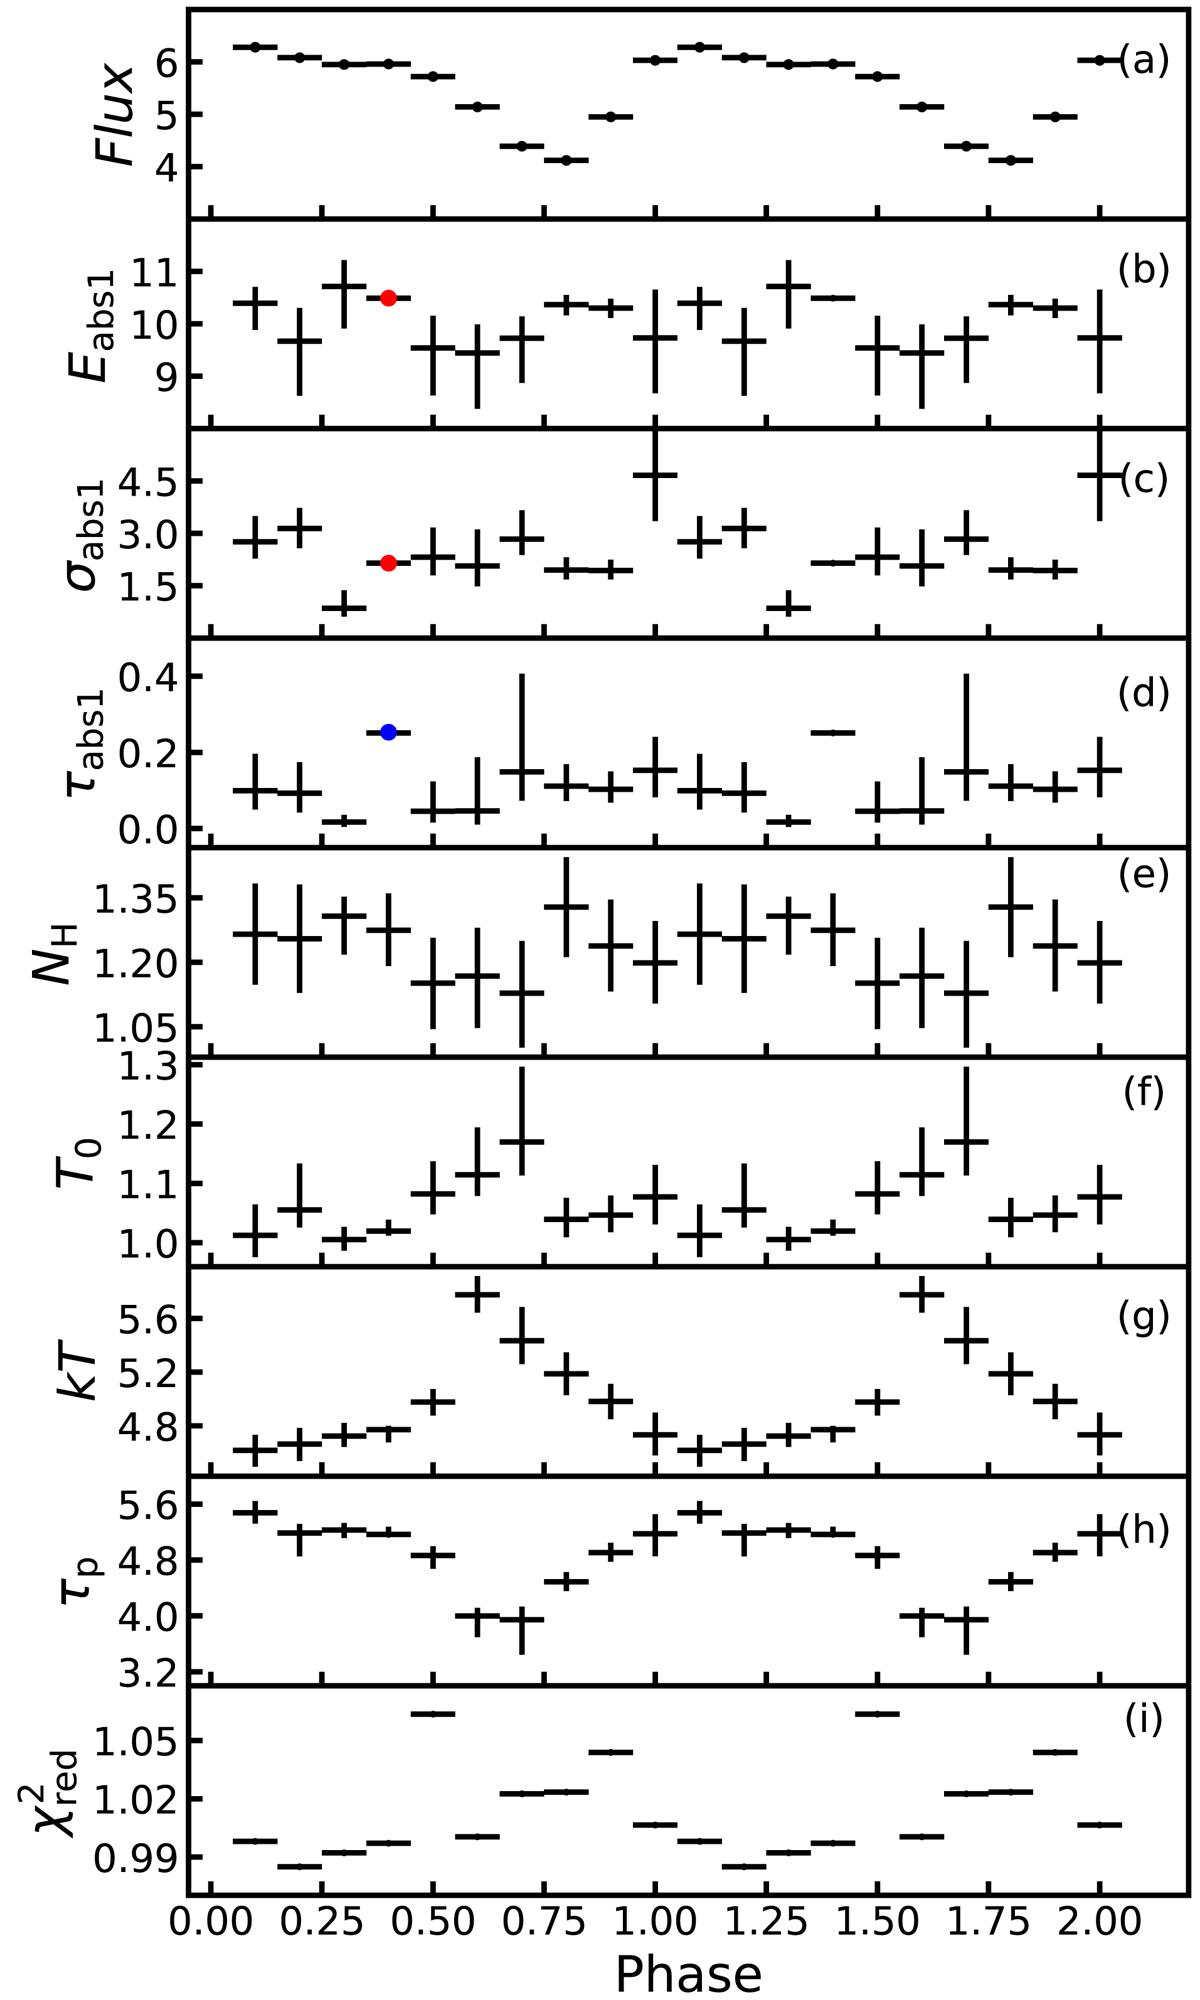
Variations of the best-fit parameters of model TBABS × (GAU+COMPTT × GABS × GABS) as a function of pulse phase obtained from the NuObs3+P0211006008. Panels a–i: observed X-ray flux in the energy band 1–79 keV in units of 10−9 erg s−1 cm−2, first absorption feature energy in keV, width in keV, and its optical depth, neutral hydrogen column density NH in units of 1022 cm−2, input soft photon temperate in keV, plasma temperature in keV, plasma optical depth, and the reduced χ2, respectively. The values of the red points are fixed at the best-fit values and the blue dot represents the 3σ upper limit of the first absorption feature optical depth. The second absorption feature parameters are shown in Fig. 11.
Current usage metrics show cumulative count of Article Views (full-text article views including HTML views, PDF and ePub downloads, according to the available data) and Abstracts Views on Vision4Press platform.
Data correspond to usage on the plateform after 2015. The current usage metrics is available 48-96 hours after online publication and is updated daily on week days.
Initial download of the metrics may take a while.