Fig. 4.
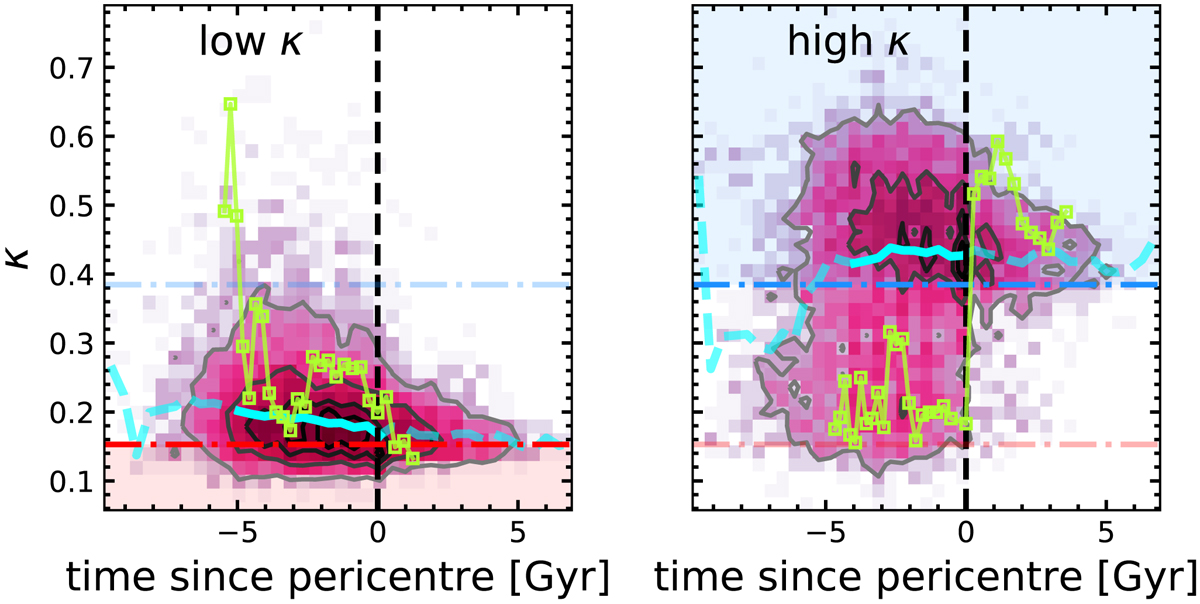
Evolution of the fraction of co-rotational energy as a function of the time since the pericentre passage for low (left) and high (right) κ sub-sample as classified by the 5th and 95th percentiles of the z = 0 κ distribution in Fig. 2. Contours show 75, 50, 25, and 5% of the maximum counts of the 2D distribution. The cyan solid line shows the median value at each time bin. For bins in which less than 50% of the sample entered the median calculation, we instead use a dashed line. The red and blue horizontal dash-dotted lines show the κ threshold values for the low and high κ sub-samples, respectively. The pericentre is marked with a vertical dashed line. In each panel we additionally show the evolution of a galaxy from the corresponding sub-sample using green square markers. The shaded red and blue regions show the allowed κ values corresponding to each sub-sample.
Current usage metrics show cumulative count of Article Views (full-text article views including HTML views, PDF and ePub downloads, according to the available data) and Abstracts Views on Vision4Press platform.
Data correspond to usage on the plateform after 2015. The current usage metrics is available 48-96 hours after online publication and is updated daily on week days.
Initial download of the metrics may take a while.